Follow the Money: How to Make the Best of This Bull Cycle by Studying Attention?
Harnessing Spaghetti Charts and Money Flows to Find Which Narrative Will Run Next!
Have you ever heard the saying, 'Money flows where attention goes'?
It seems like an obvious truth, right? But do we really spend enough time studying narratvives, metas and shifts in buyer's attention?
A good number of investors have failed to reach their targets or, even worse, lost money in recent months while market offered many opportunities. This is often due to past cycles creating the illusion that one can simply invest in a project with a decent product, solid tokenomics, and a good team, then cash out with a 10x+ profit when the time comes. You might think it's just a matter of sitting back and waiting.
But can we really rely on this strategy moving forward in this bull cycle?
According to data from Token Unlocks, the last quarters of 2023 and the first of 2024 saw all-time highs in token launches on top centralized exchanges (CEXs). There were 115 Token Generation Events (TGEs) in the first quarter and 99 in the fourth quarter of 2023.
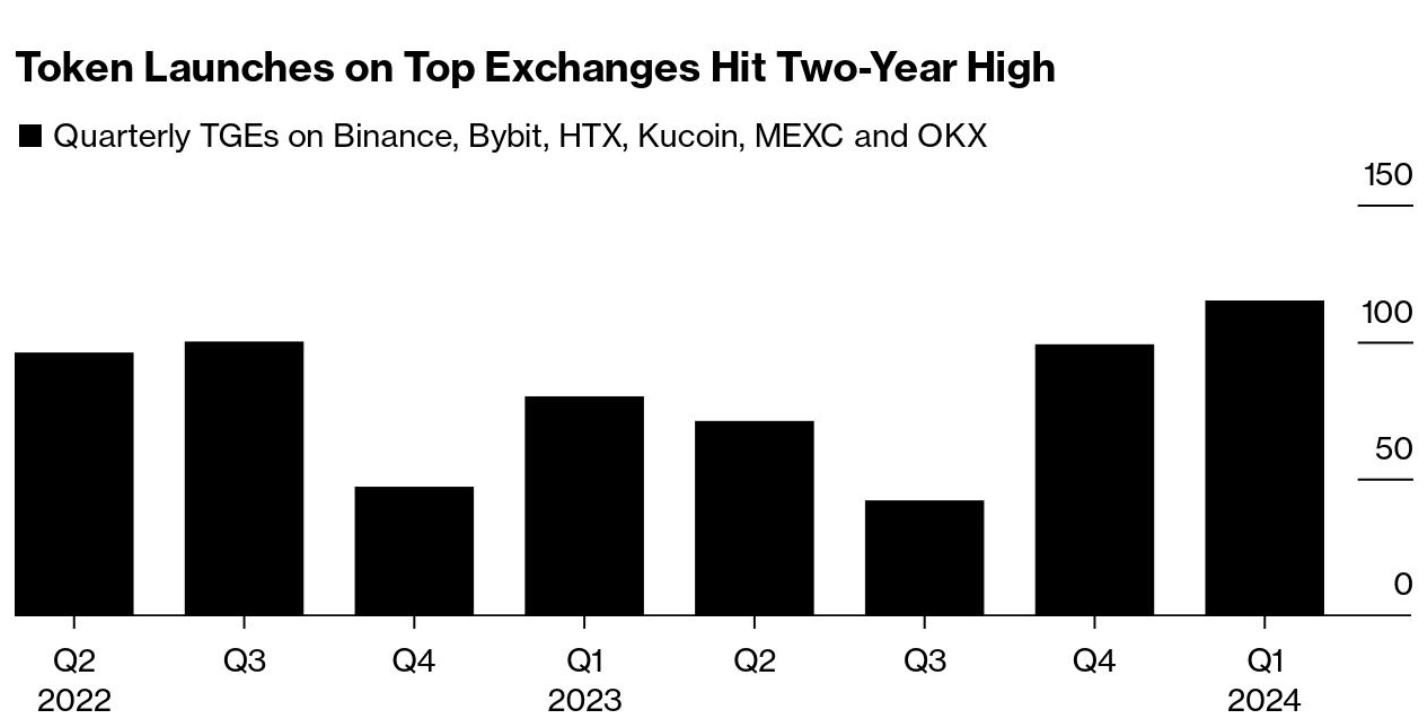
Despite the influx of new tokens, there's not enough demand to match this supply. Why? Simply put, not enough new people are joining the Web3 movement.
How do we know this? The user @nicrypto lists several compelling arguments to support this thesis. You can check out the detailed arguments here:
Retail is far away...
— Nic (@nicrypto) May 3, 2024
While hopes Bitcoin ETFs would spur retail interest, it hasn't picked up at all.
How far away is it? Let's take a look 👇
We're still in the midst of this bull cycle, and its outcome remains uncertain. Perhaps we're approaching a phase where you can indeed throw money around and reap huge profits in a short time.
However, given that the market is currently overwhelmed with supply, our goal should be to identify ecosystems and projects that are attracting the most investment within the crypto market. Until the balance of supply and demand changes, this strategic focus will be crucial for success.
How to Outperform Most Market Participants by Studying Attention?
When we analyze the 2024 performance, we notice that coins like $WIF and $PEPE, which lack a fundamental use case, outperformed fundamentally strong projects like $SOL, $ETH, and many others. There are various reasons for this, but today, we won't delve into them. Instead, we'll focus on the tools that can help you to spot those opportunities before they are obvious to the masses.
Our goal is to identify and hold onto the strongest performers. Understanding where the market's attention is, will help us select those coins and ride the wave until the attention shifts elsewhere.
Crypto Market Screeners
If you've been in the crypto space for more than a few weeks, you've likely come across market data aggregation platforms like CoinMarketCap, CoinGecko, Dropstab, and others. These platforms are excellent for finding basic information about a ticker, such as market cap, fully diluted valuation, website, and social platform links. However, many of their powerful features are under-utilized by most users.
The "Categories" page is particularly useful for spotting ecosystems and narratives that have performed the best in the last 24 hours. Simply filter by average price change, and the top performers will be listed at the top of the page.
It's important to note that while you can click into the ecosystem to see which coins were the best performers, this doesn’t mean you should immediately pick the top coin and jump into a trade. However, by observing the trends daily, you will soon start recognizing the names and ecosystems that frequently pop up among the top performers. This insight can be invaluable for making informed trading decisions.
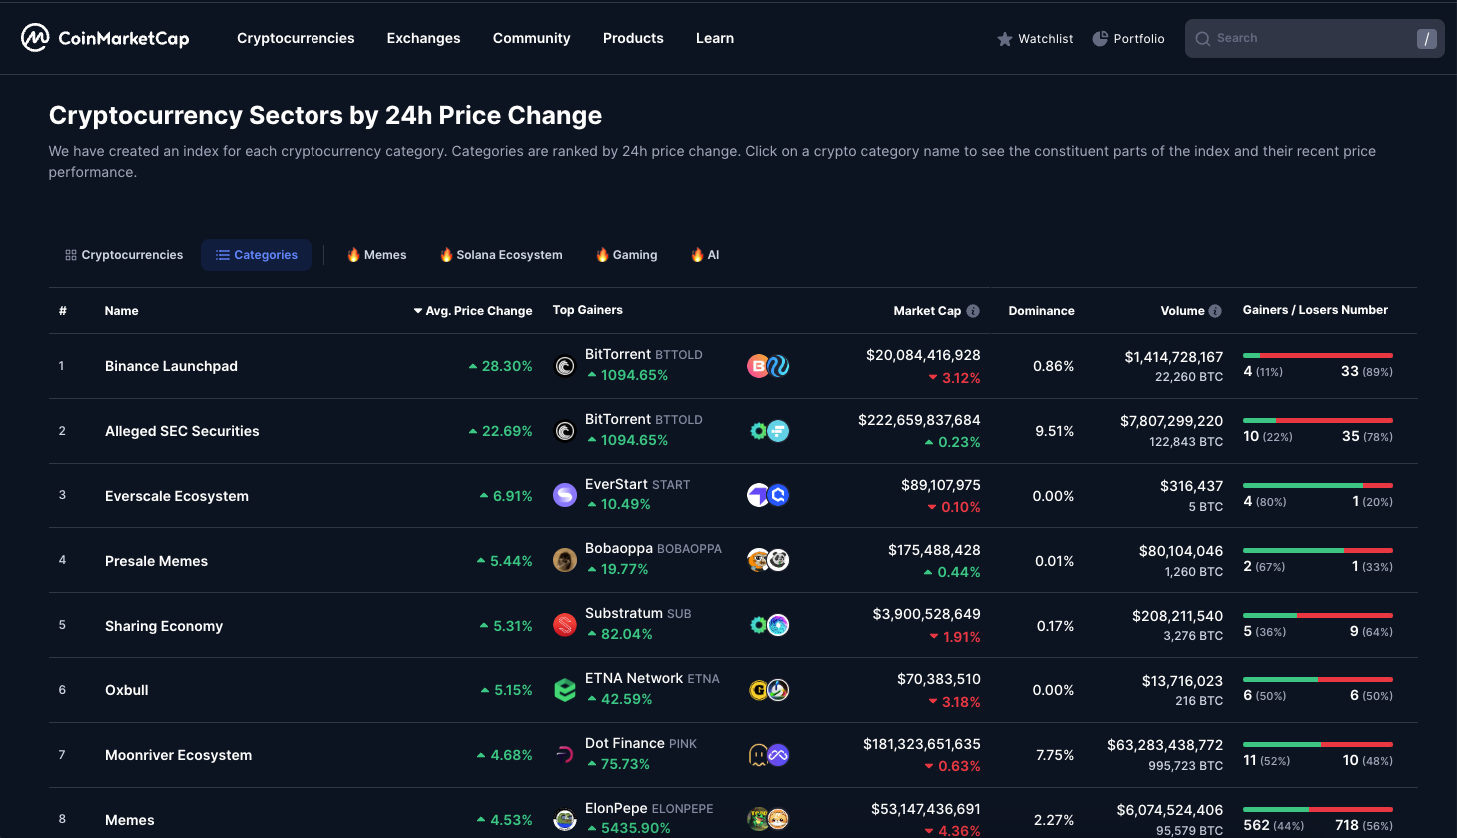
Take notes on the tickers that held up well in the downtrending market, as they are likely to bounce back the best when the market trend shifts.
Market Data Aggregation Platforms: Advanced Level
While many are familiar with platforms like CoinMarketCap or CoinGecko, there are similar tools that provide more advanced market data without the need for paid plans or token holdings.
One of the standout platforms is Coinalyze.
On the front page, you'll find a token list with numerous columns. You can apply filters to these columns to help identify your next winning trade.
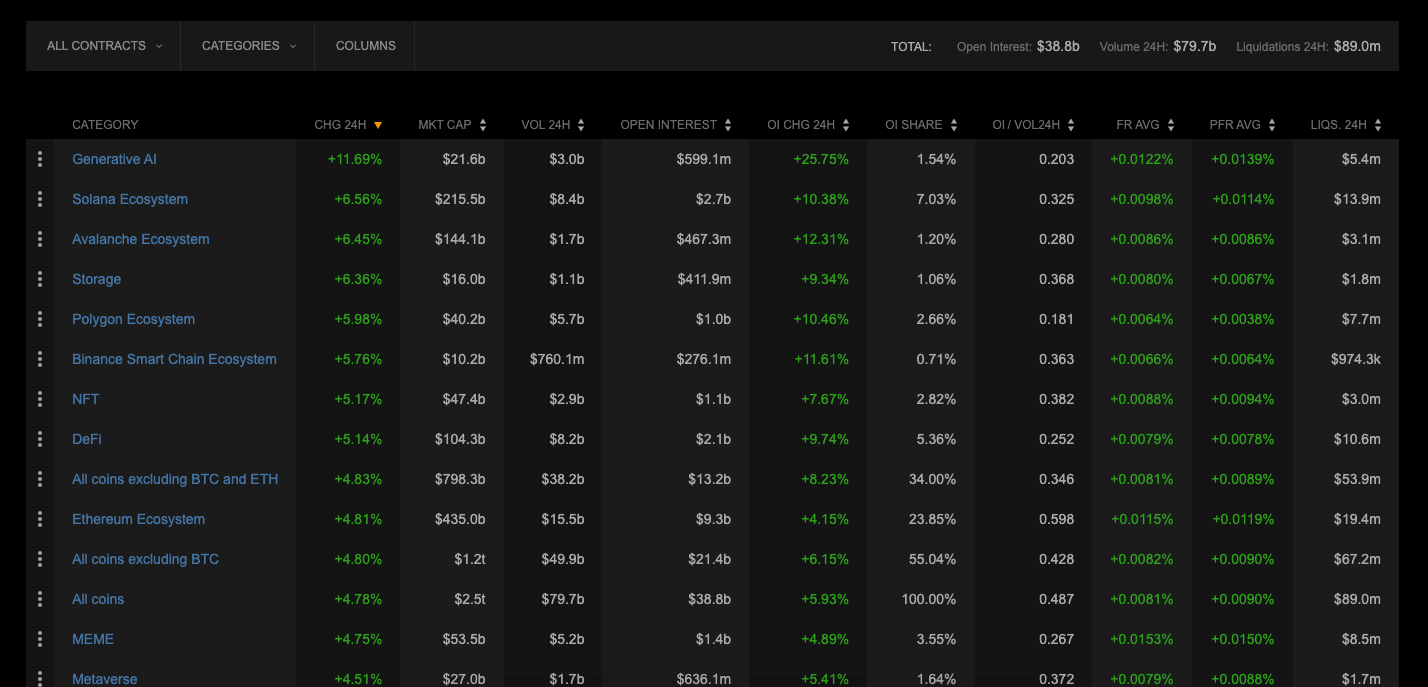
By applying the “categories” filter and then sorting the results by the 24-hour change, we can observe that the categories that appreciated the most in the last 24 hours were Generative AI, Solana Eco, and Avax Eco. Same as with Coinmarketcap, we can further analyse those ecosystems.
Coinglass is a direct competitor to Coinalyze, featuring a different user interface but essentially offering very similar market screening capabilities. Like Coinalyze, Coinglass allows users to view the strongest narratives and delve deeper into each narrative to discover which coins are performing best.
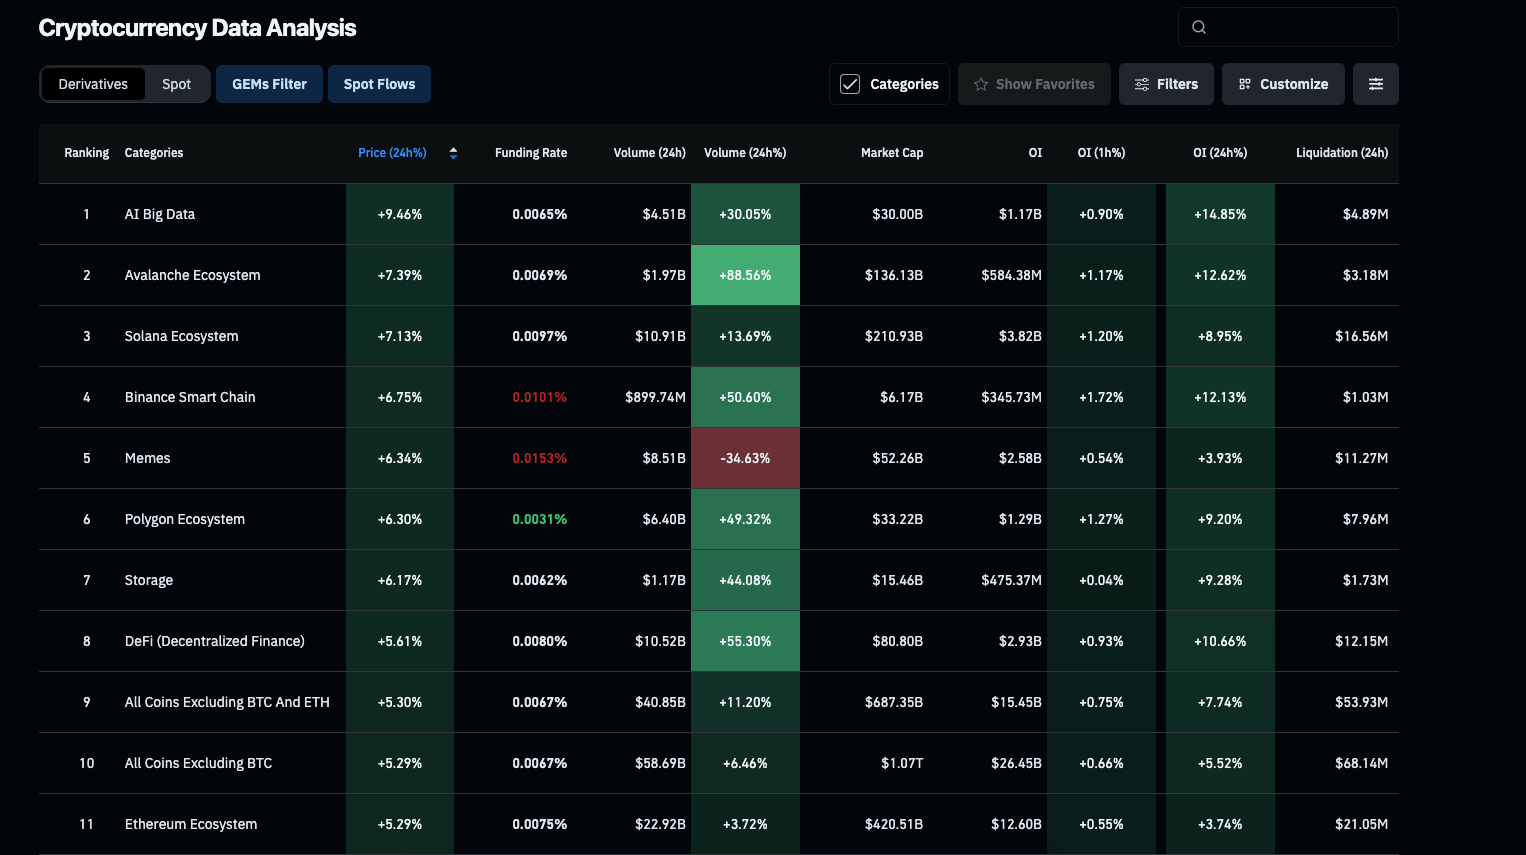
If we analyze the AI Big Data category further, we see that the top performers were PHB, RLC, and AGI. From there, we can open the charts to see if a trade entry parameters are met.

A very useful metric to consider is Open Interest (OI). OI is defined as the total number of open positions (including both long and short positions) currently active on a derivative exchange for that asset. Sorting the coins by OI reveals where futures traders are concentrating their investments. You can even sort the tickers by 1-hour OI change to find a potentially winning trade, as rapid changes in OI can be a strong indicator that something significant is about to happen.
View The Crypto Koryo Narratives On The Dunes Dashboard
Continuing with free tools, the next one comes from a member of the crypto community. CryptoKoryo has built a Dune dashboard which breaks down narratives and ecosystems.
This tool is particularly useful as it provides insights into narrative performance over various time frames—daily, weekly, or even annually. Understanding the winning narratives in this cycle can be invaluable when building your long-term holdings.

But what if you need more flexibility in terms of narratives or tickers observed? Well, TradingView, a platform you're likely already using to chart your favorite coins, has some hidden features you can leverage in your market attention analysis.
Trading View Secrets For Market Strength Observation
Have you ever heard of a Spaghetti chart?
Despite the playful name, this alternative view on the TradingView interface provides a very clear perspective of the strongest coins in a single window.
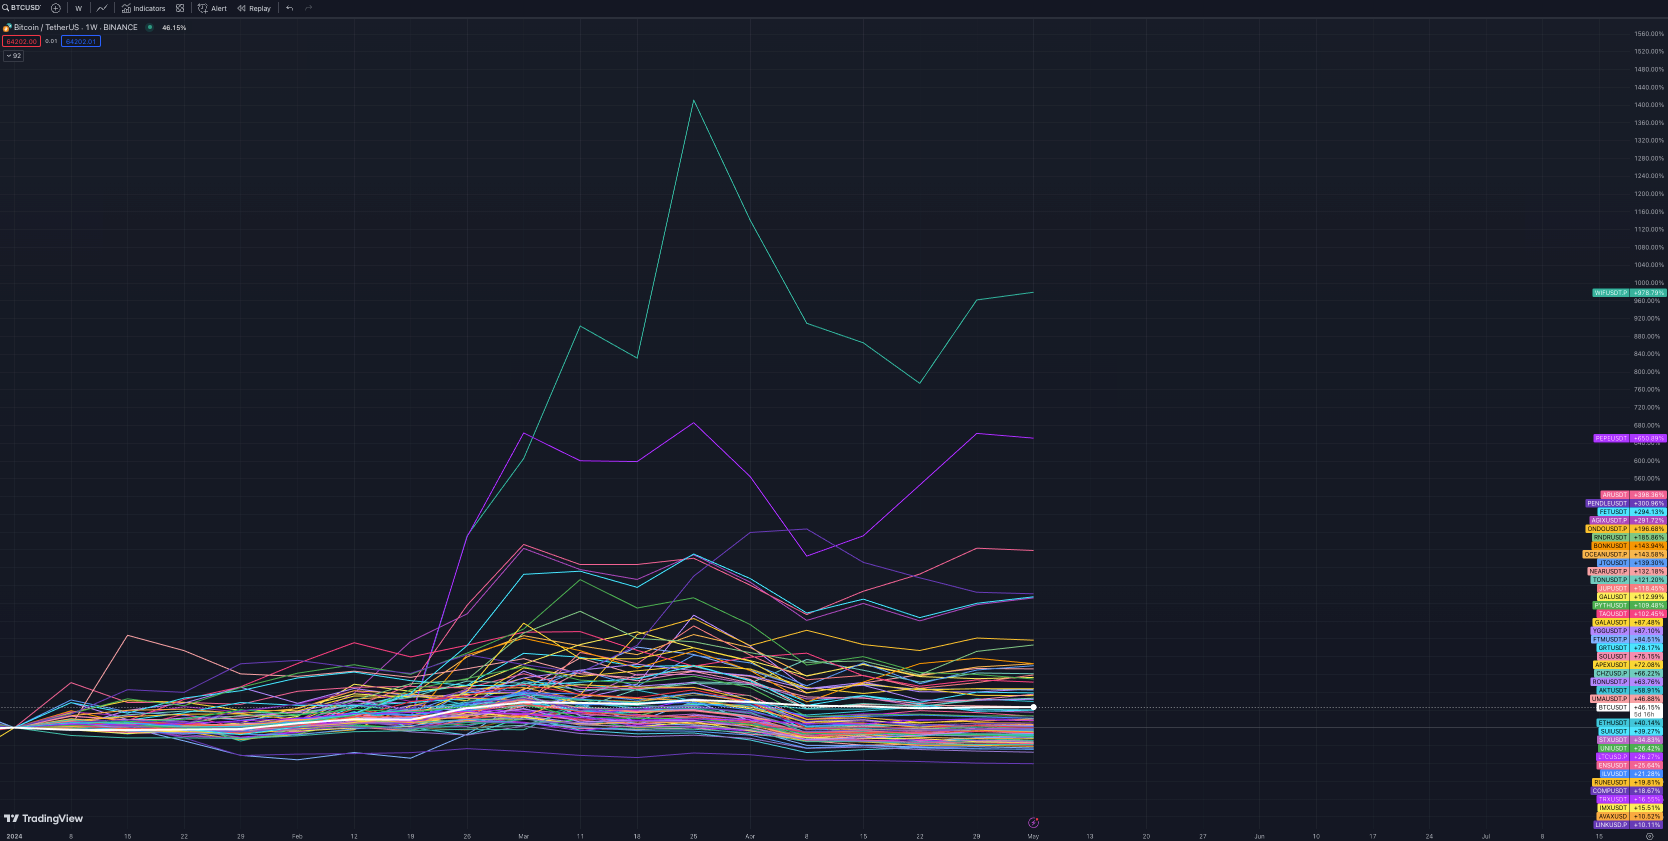
The image above illustrates the performance of nearly 100 crypto tickers, starting from January 1, 2024. With just a quick glance, you can determine which coins have outperformed BTC during this period.
One of the best features is that the scale of the chart can be adjusted simply by scrolling your mouse wheel. This allows you to set the starting point wherever you prefer. Discover the top monthly or weekly performers, identify which tickers performed well over the weekend, and see which coins recovered the best after a dip.
How to Set Up the Spaghetti Chart on TradingView?
The flexibility of the Spaghetti chart comes from the ability to add any the coins you want to observe. This lets you monitor your chosen list and eliminate all the noise.
- Open TradingView and change the chart type from Japanese candlesticks to Line. Use BTC chart as a base chart.
- Hover over the ‘+’ button located on the top left next to a ticker and click it.
- Type the name of a ticker in the TradingView finder, then click on it to add it to the chart on the same scale.
Keep in mind, the free plan limits how many tickers you can add, so a subscription is required for managing a larger list.
But that’s not all there is to it!
Other Ways You Can Utilize the Spaghetti Chart
TradingView allows you to merge tickers, enabling you to decide which tokens you wish to include in your "narrative" chart.
Sounds a bit confusing? Let's clarify with an example:
Suppose you want to compare which narrative bounced back best from the recent low on May 1st.
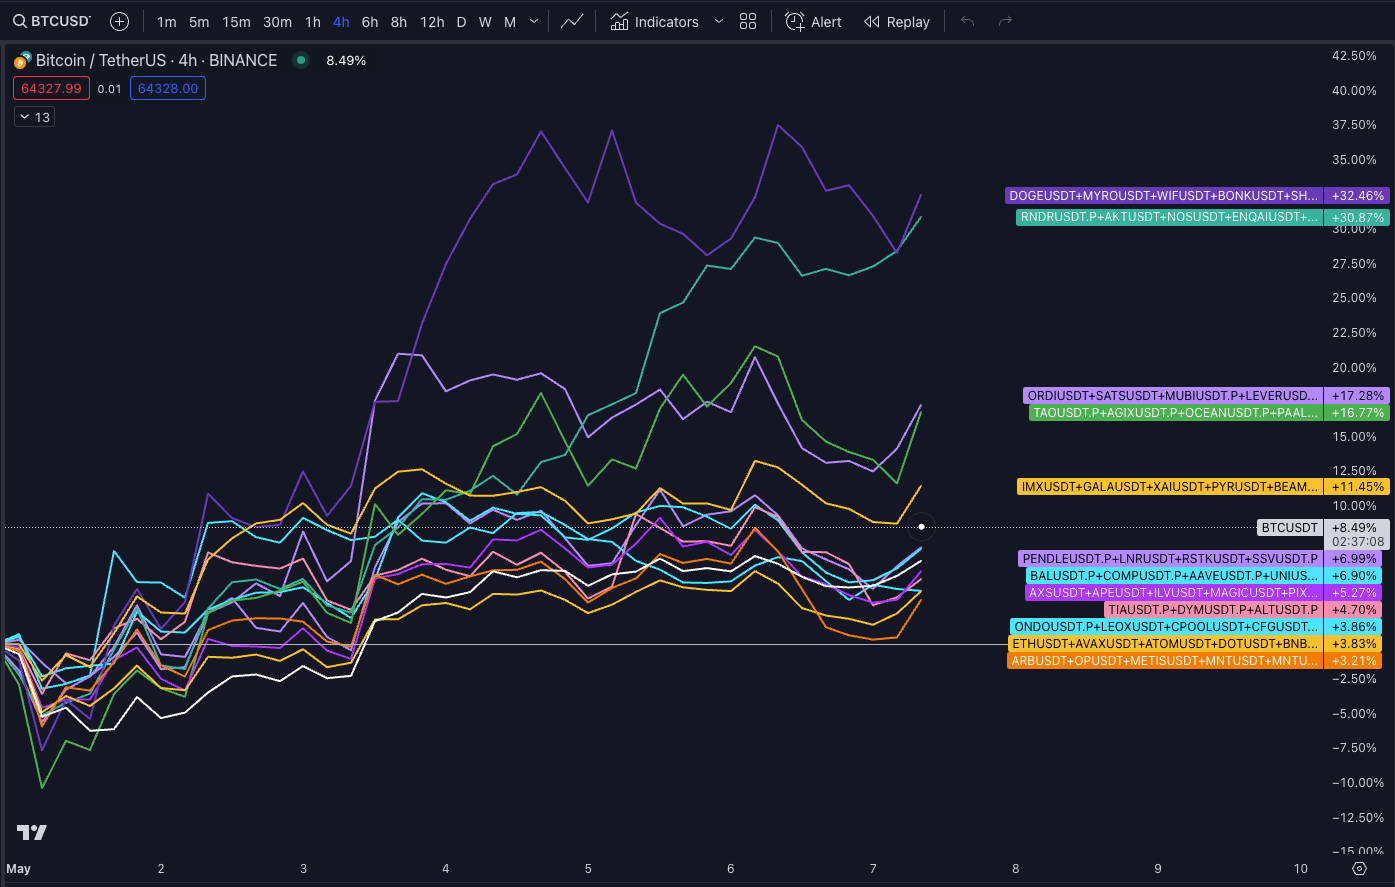
- Choose the Narratives: Decide which narratives you want to track, such as L2s, memes, or AI.
- Add a Leader: Start by adding a line chart of a leader in that category, typically the one with the largest market cap.
- Merge Tickers: Right-click on the line and enter settings. Click on the pencil to edit the symbol and add a "+" sign in the search bar.
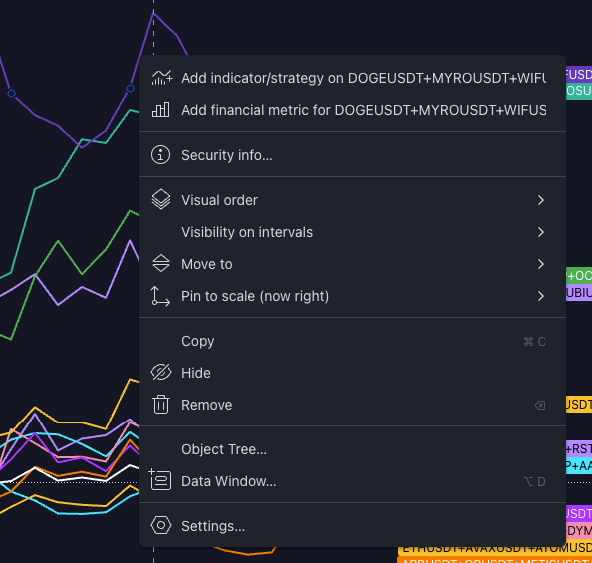

4. Type and Merge: Type the name of another ticker you want to merge with the existing line. You can add multiple tickers if you wish.
By following these steps, you can create a comprehensive narrative chart that helps you analyze and compare the performance of different tokens within specific categories.
Leverage Spaghetti Charts For Free On Velo
If you're hesitant to pay for a TradingView subscription, there are other free alternatives for leveraging Spaghetti charts.
Velo is an excellent platform packed with powerful features and market indicators. It also offers various ways to gauge market strength using Spaghetti charts.
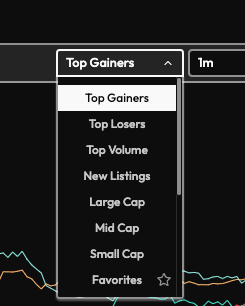
To explore these features, head to the 'Market' tab. At the top of the page, you'll immediately see the price changes of the top gainers in the last 24 hours displayed in Spaghetti view. Velo Data allows you to view different market sectors. Whether you wish to observe large, mid, and small caps, or even new listings, you have the option to do so. The 'Favorites' tab lets you build and track a list of your preferred tickers.
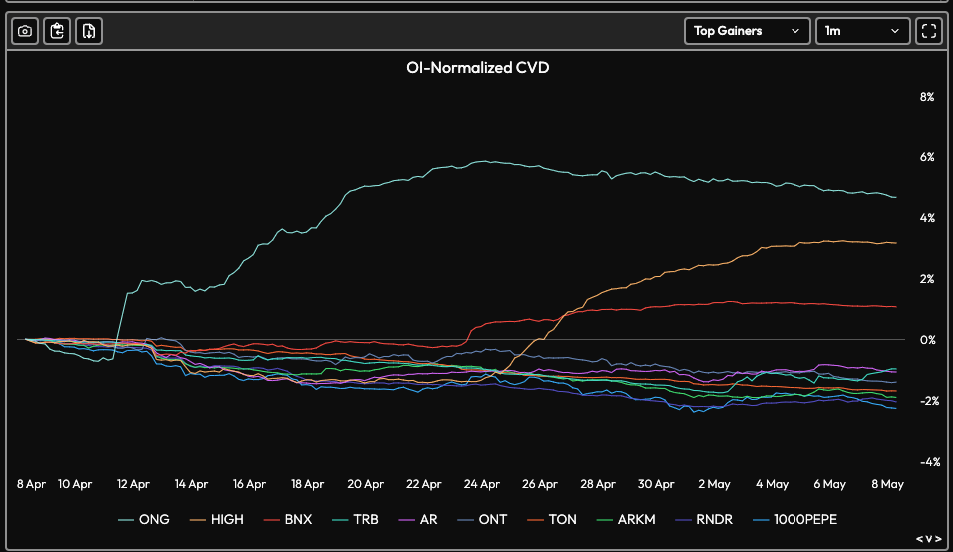
But that’s not all Velo Data has to offer. Further down, you can view another Spaghetti chart, this time focusing on charts based on open interest (OI) and OI weighted Cumulative Volume Delta (CVD).
As we learned earlier, OI can be a powerful indicator as it shows where the most perpetual trades are taking place, offering insights into market dynamics.

Follow the stablecoins
One of the most utilized free platforms for on-chain data analysis is DeFiLlama. It offers many useful features, and one particularly helpful tool is the ‘Stables’ tab. Stablecoins act like fuel for uptrends, and knowing which chains are attracting stablecoins can help you choose your next trade.
There are several ways to analyze stablecoins on DeFiLlama. On the overview page, you'll see a list of stablecoins sorted by market cap. However, we're particularly interested in the leading stablecoins, USDT and USDC.

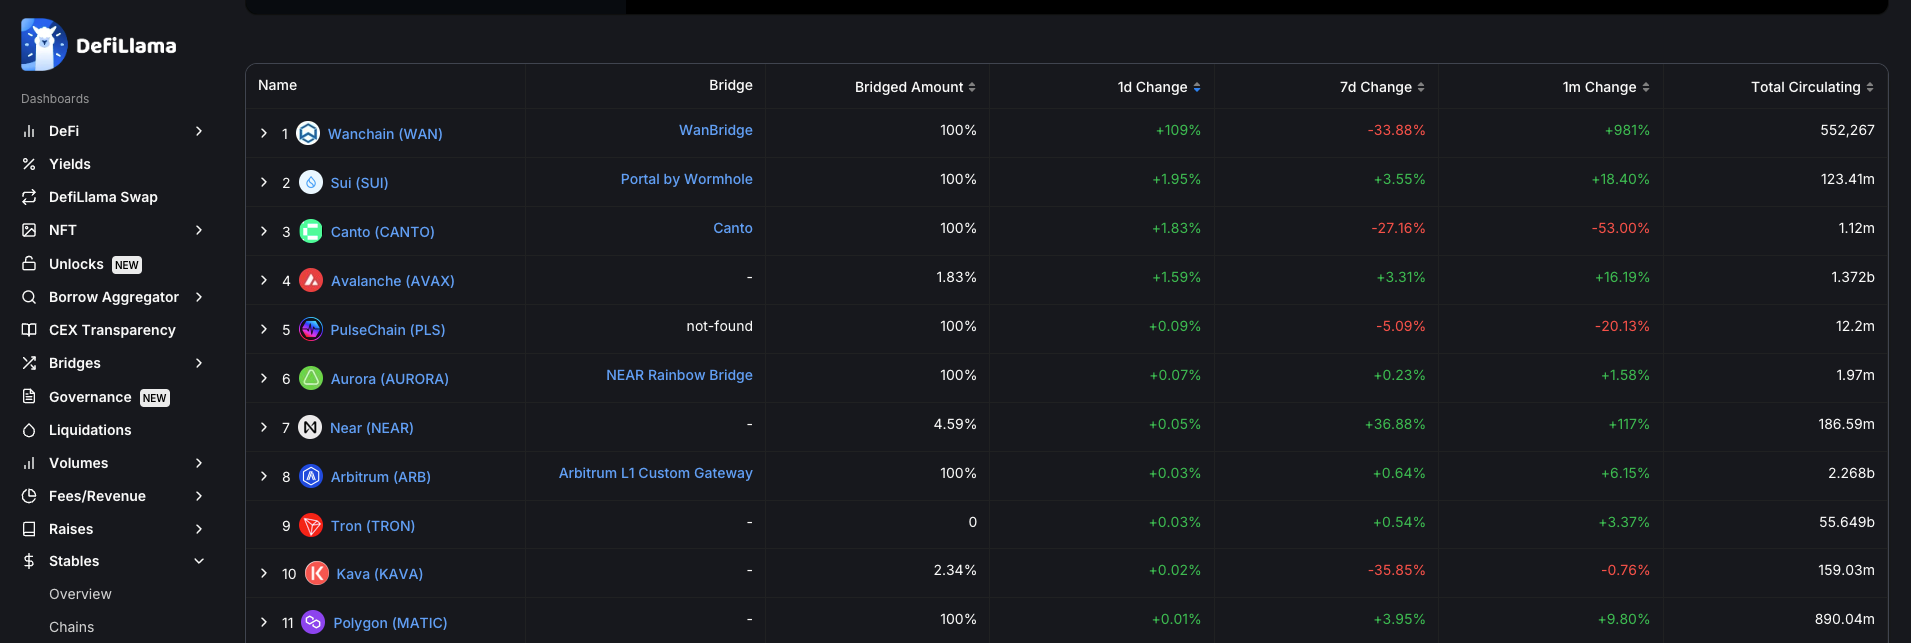
It's incredibly useful to identify which networks are experiencing the largest inflows of stablecoins. For example, by clicking on Tether, you can view the chains that support USDT. You can then sort the data by 1-day, 7-day, or 1-month changes. Sorting by 1-day, we notice that the stablecoin supply on Wanchain increased by over 100%. It’s important to note the context here: the total TVL of stablecoins on Wanchain is just over $0.5 million, which is relatively insignificant. Thus, this doesn't necessarily mean we should look for a trade on Wanchain. However, in other instances, significant increases in stablecoins on a chain should be closely monitored.
You can use the same steps to research flows for any stablecoin. For aggregated data that includes all stablecoins on a chain, simply use the ‘Chains’ tab.
Here you can sort the chains by stablecoin TVL increases in the past 7 days.
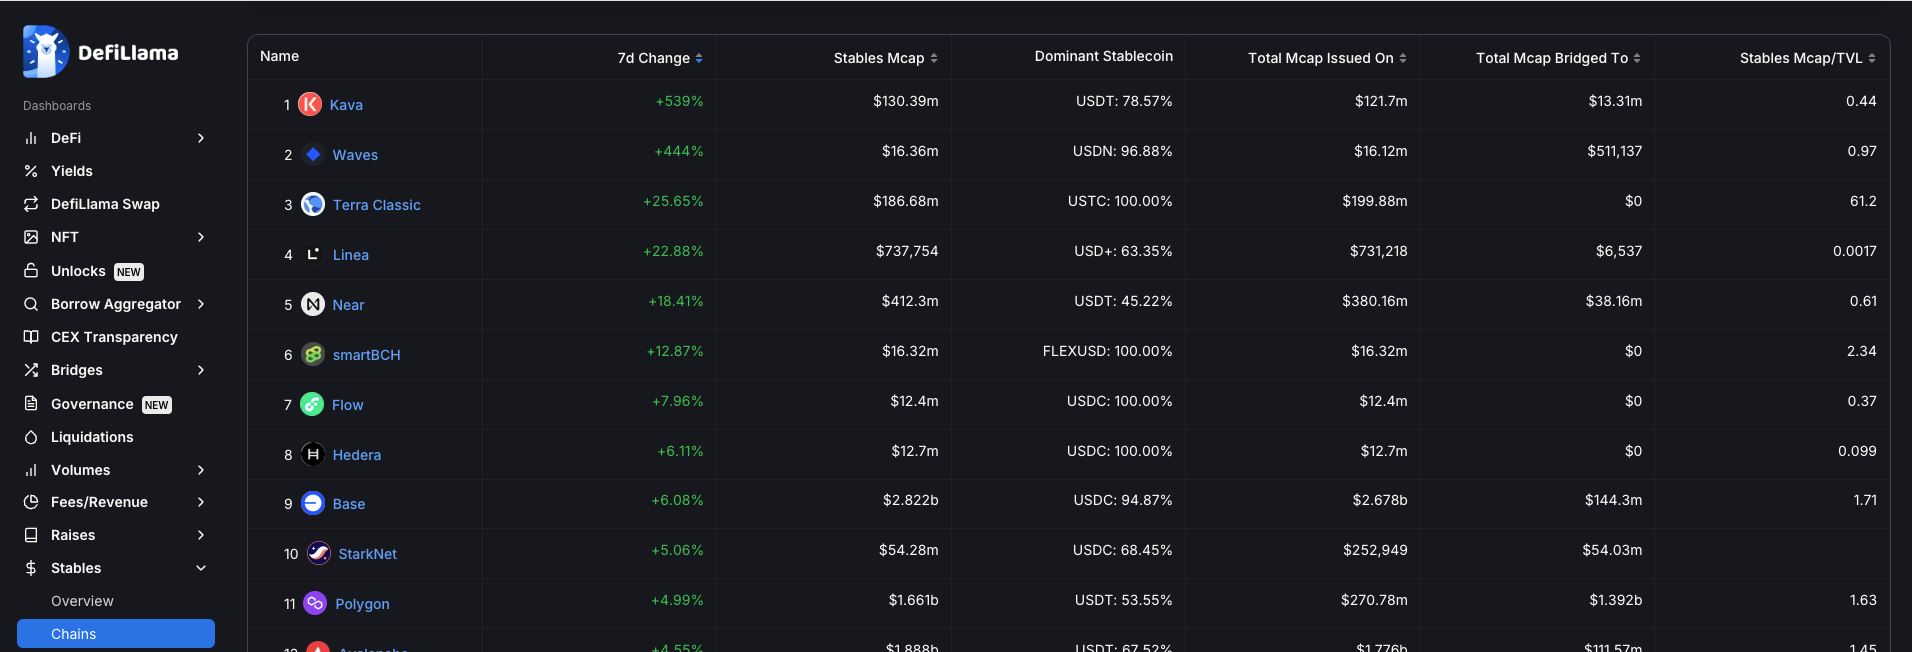
Today, for instance, Kava shows a significant increase in TVL. If we click into the chain to investigate further, the recent spike is clearly evident on the chart:
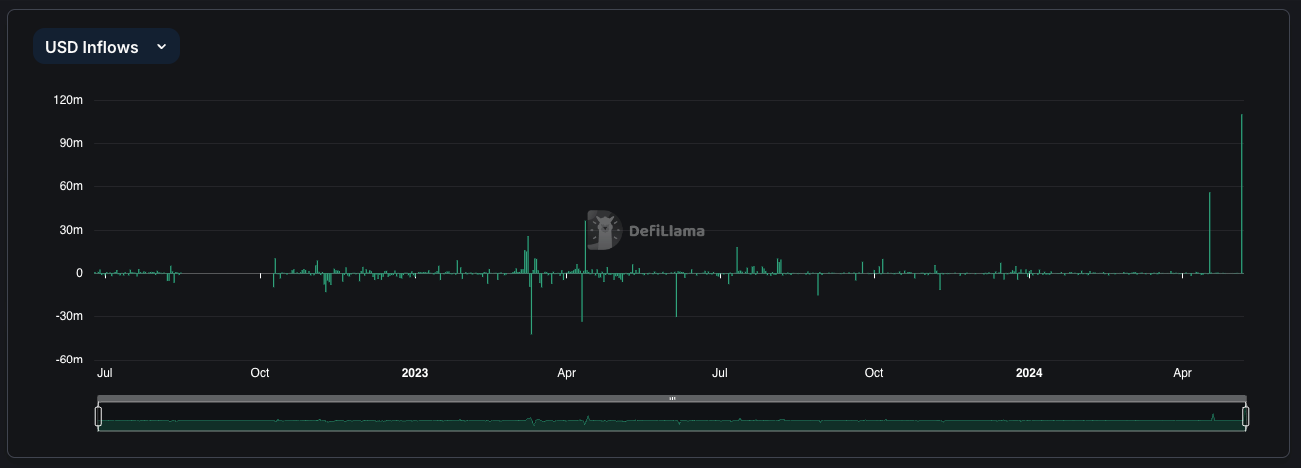
While this data alone isn't enough to make a trade decision, it demonstrates how powerful observing stablecoin flows can be. Take the Near chain in recent months as an example:
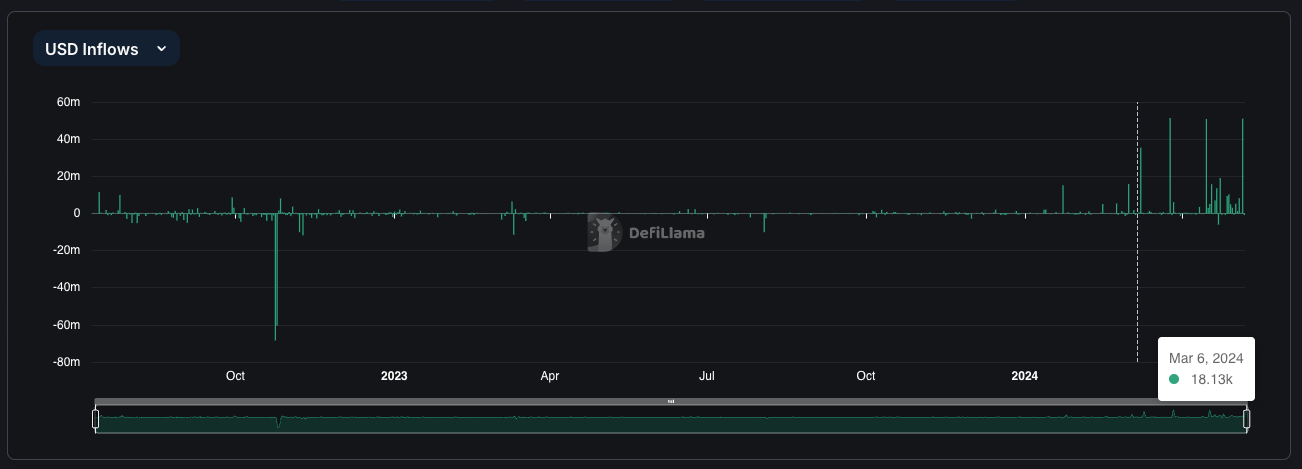
We observed four significant stablecoin spikes within two months. During this period, while the overall crypto market was trending downward, NEAR was one of the few coins showing relative strength. That’s a piece of actionable insight!
Follow The Money
Remember, while these tools provide valuable insights, they are best used as part of a broader strategy that includes market research, trend analysis, and continuous learning. Stay agile, stay informed, and use these insights to spot opportunities that others might overlook.
