The crypto market has been rough recently. Bitcoin has been going down for almost 3 months now, funds as big as 3 Arrow Capital are facing liquidations, fear and greed index is at the record low levels.
W. Buffet says, “be greedy when others are fearful”... is it the time to be greedy? While the author of the article is not a registered financial advisor and does not tell you to buy BTC right now, the Glassnode charts do.
Let’s look at the 5 charts that have been pretty accurate during the lifetime of Bitcoin to indicate cycle bottoms or the good times to accumulate.
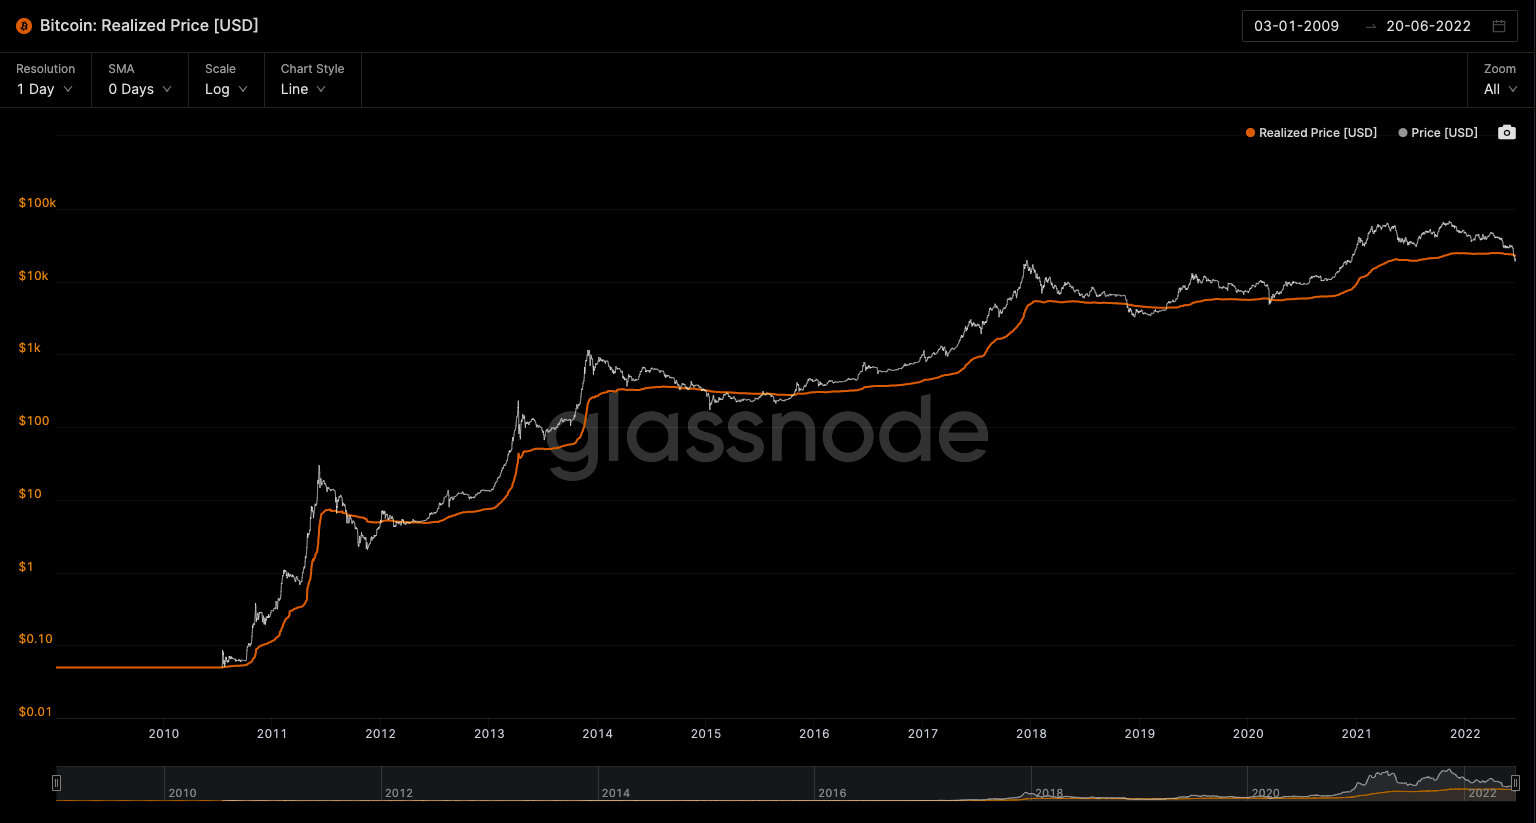
Realized price
The realized price is the value of all the coins at the price that were bought divided by the amount of BTC that is in circulation. Simply put, it measures the average price investors paid for their coins.
Most users do not want to sell below the value they bought, so when the price of BTC is close to that of the Realized Price, sales slow down. If you look through the history, the Realized Price below the BTC price always showed good levels to accumulate.
BTC's price is already below the level. How long will it stay below? Who knows? In 2014-2015 BTC stayed there for 10 months, and in 2018-2019 – 4 months.
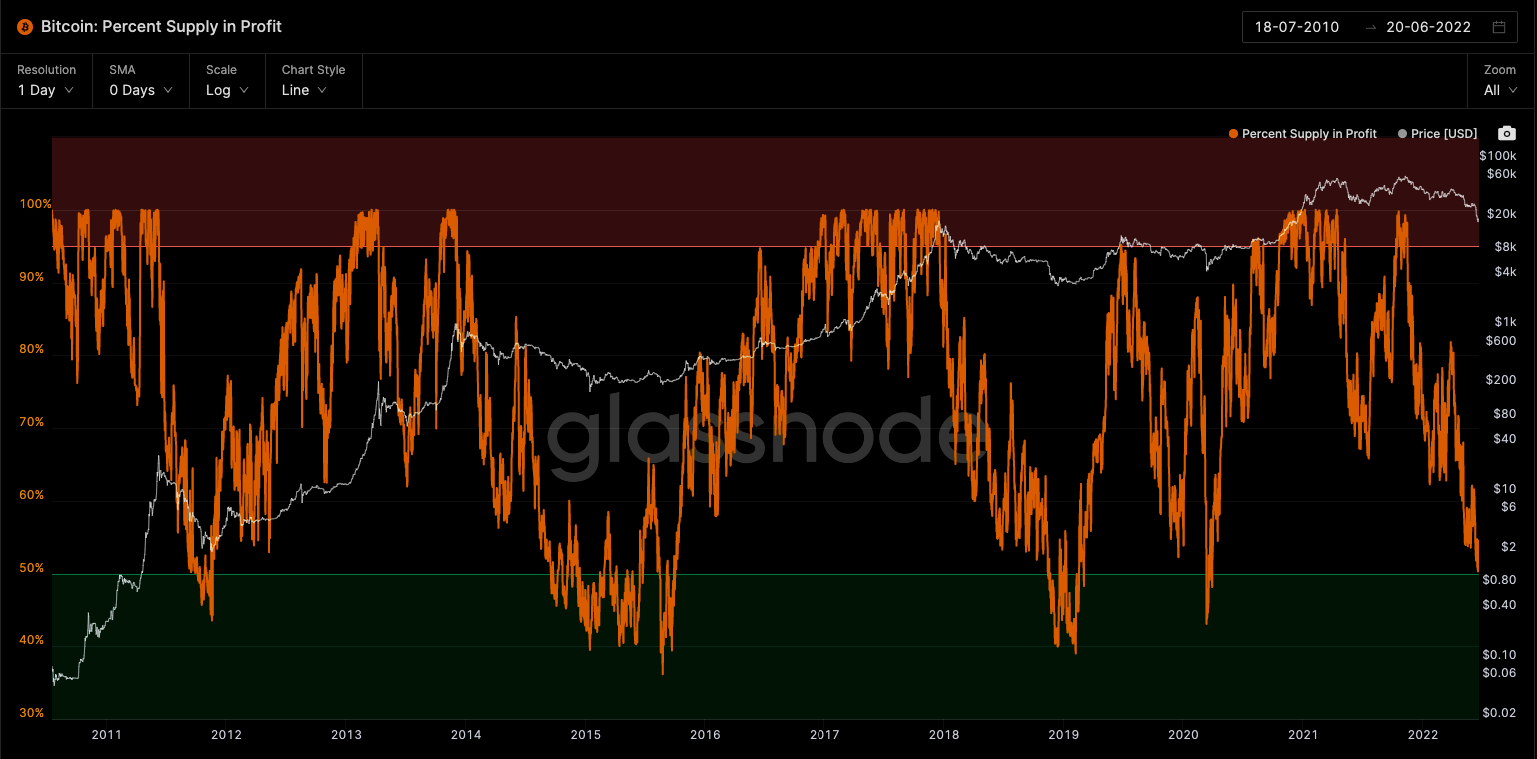
Percent Supply in Profit
Percent Supply in Profit is another chart that is widely used to catch cycle tops and bottoms. It highlights the percentage of the total supply which is currently in profit. Generally, values above 95% suggest market tops, while values below 50% signal bottoms.
If you would have been buying BTC while the Percent Supply in Profit metric is in the green zone and selling it when it is in the red zone - you would be doing pretty good so far. Right now, the chart is about to enter the green zone.
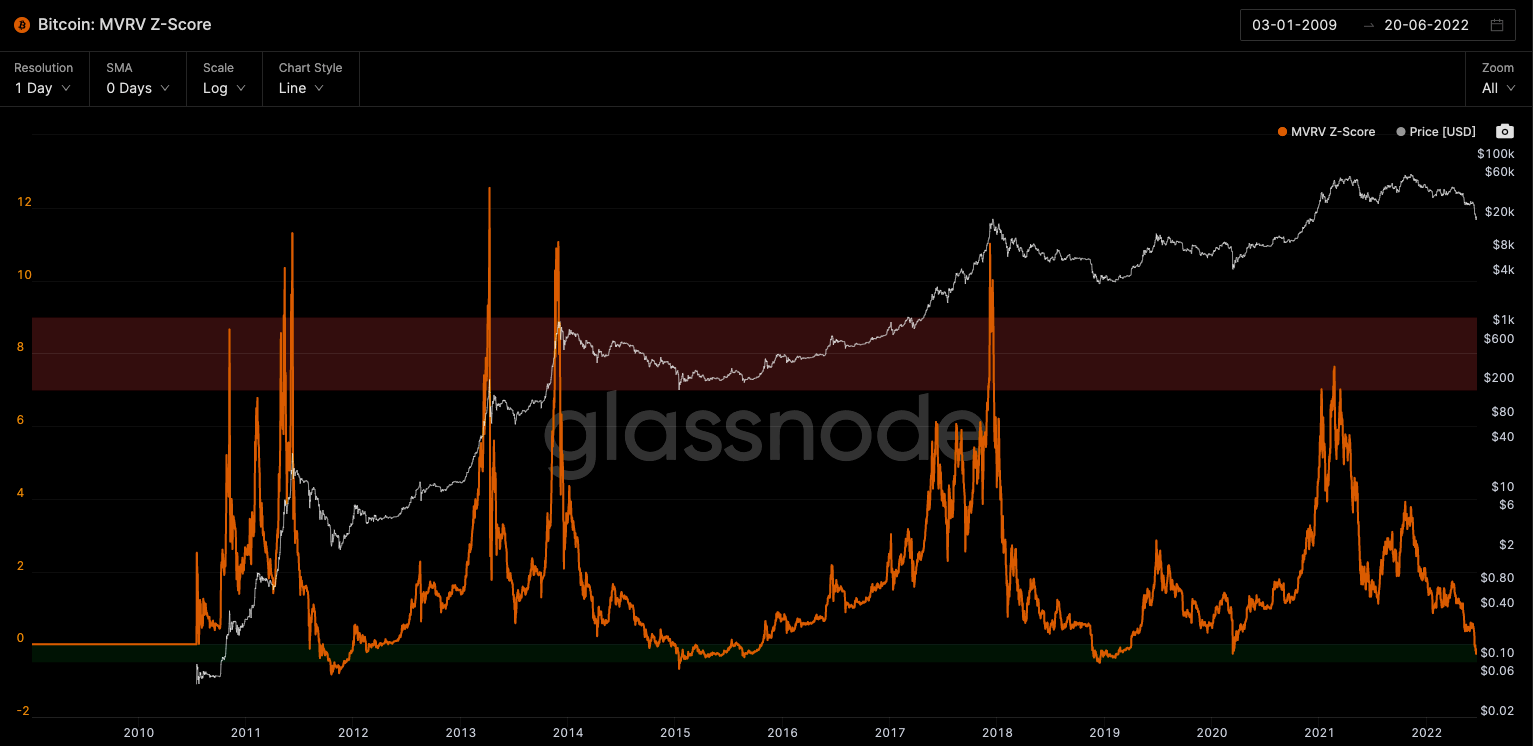
MVRV z-score
MVRV z-score is a great chart to follow. It shows periods where Bitcoin is extremely over or undervalued relative to its 'fair value' and it has been pretty consistent in showing tops and bottoms.
The recent BTC crash to $17.6k pushed this metric to below 0, the level where historically buying BTC was a good choice.
Right now, the metric is as low as it was during the COVID crash, but it doesn't mean that only up from here. MVRV z-score can stay in the buy zone for months.
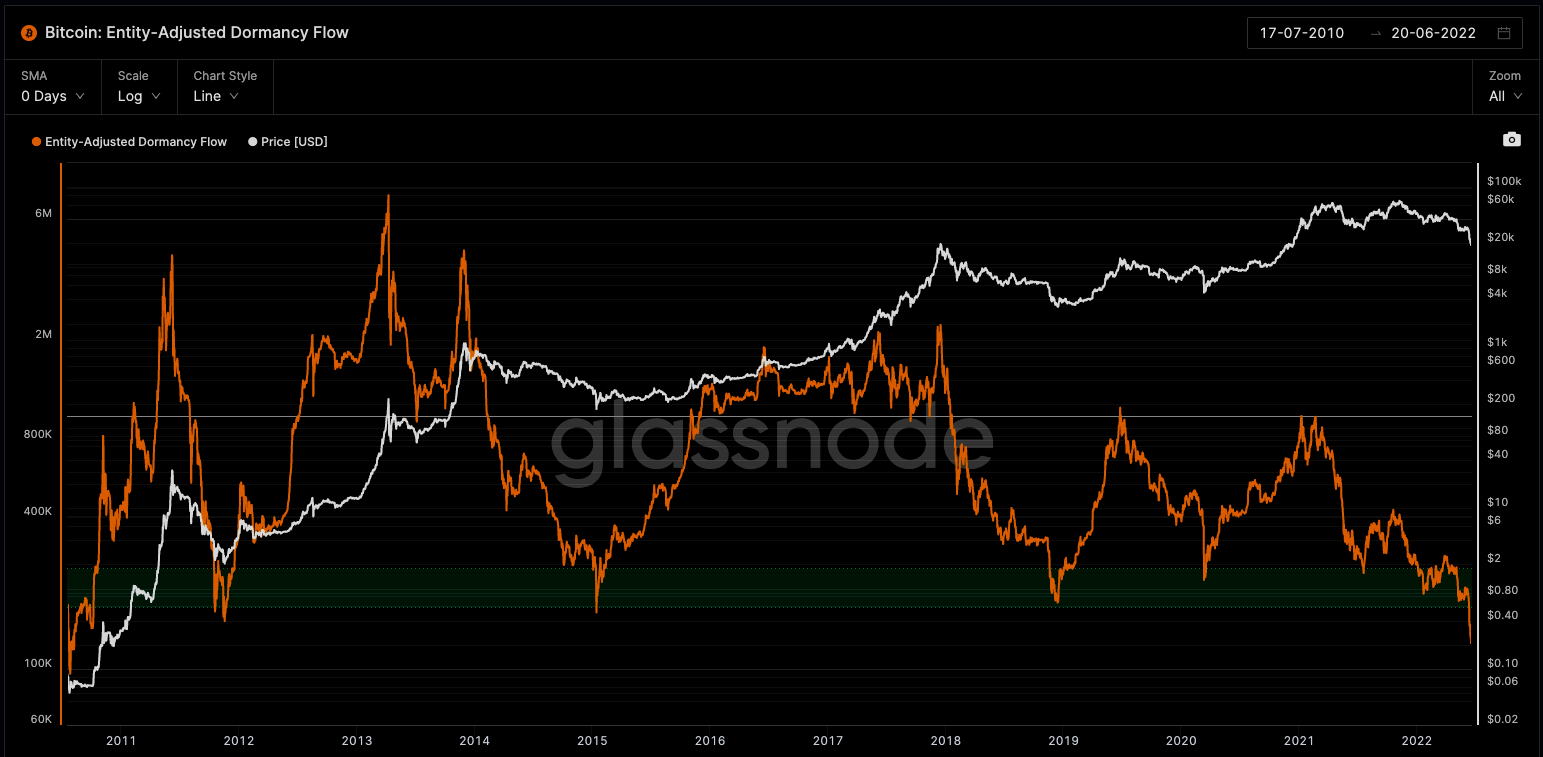
Entity-Adjusted Dormancy Flow
Dormancy refers to the average number of days each coin transacted remained dormant or unmoved, a gauge of the market's spending pattern.
High values mean that old coins are moving, while low dormancy means that new coins are moving—overvalued or undervalued relative to the sum of coins in transaction without the noise of trading volume.
At this point, the indicator is at the lowest level ever (if you disregard the BTC infancy in 2010). Either this signal is broken or this is one of the best accumulation opportunities for BTC.
Reserve Risk
Reserve Risk is another chart that can tell you good levels to enter or exit the market. It is a chart that allows you to visualize the confidence amongst long-term bitcoin holders relative to the price of Bitcoin.
The indicator is at low levels when heavy investor accumulation and HODLing is the preferred market strategy.
The indicator hit the level of 2015 lows a day ago. In 2015, it marked the bottom. Did it market the bottom in this cycle? The future will tell!

Remember that the current macro conditions have never been so bad since Bitcoin was born. We are likely heading into a recession, the stock market hasn't bottomed yet, and the crypto market will follow the general sentiment of the global economy, which is yet to show any positive signs.
While the Glassnote indicators scream BUY NOW, it doesn't mean the BTC and the crypto market will not go lower. In fact, in the previous cycles, BTC corrected by 83-86% from the top. Going 83% down from ATH would take us to the ~$12000, which is also a very logical horizontal support level.
Don't be reckless young man!