Quite recently, Bitcoin fell to almost USD 25,000, nearing the price average of a holder. Historically this is called the realized price (USD 24,000 to be exact), and it presents excellent buying opportunities for the investors during times of capitulation. This news was also driven by the recent scandal in the Terra Blockchain and increased sizes in hostile options activity, but still, support levels do show some interest in buying the lows out.
Current BTC flow - bullish or bearish?
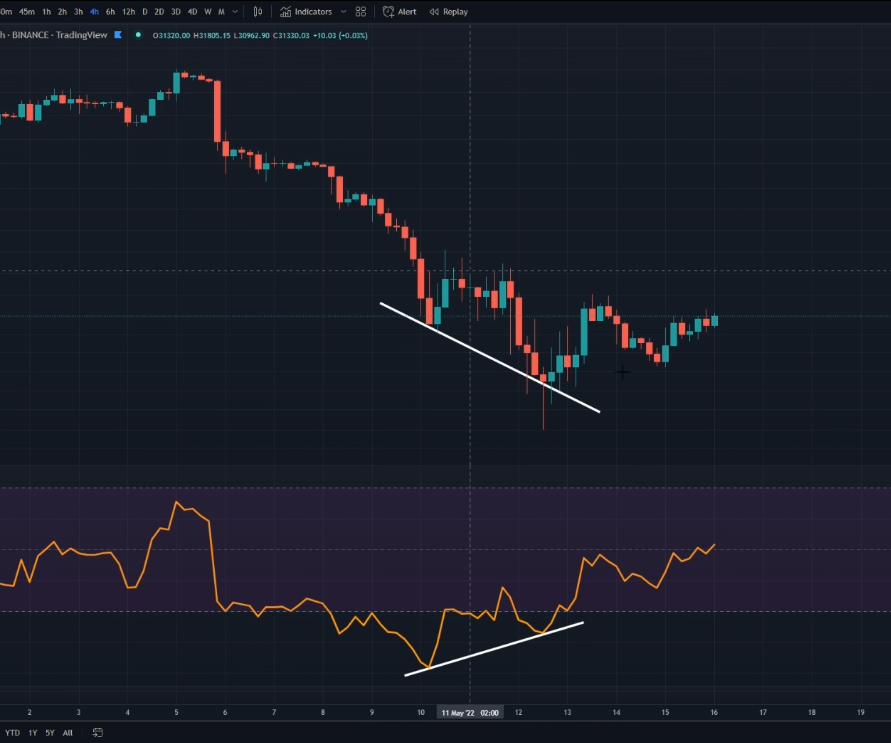
Bitcoin has found a lot of support on the USD 28,000-29,000 line for quite some time. 4-Hour charts indicate bullish divergence as the upward RSI is gearing up for a slight move. This means reduced selling pressure and sideways chopping price action in the short term.
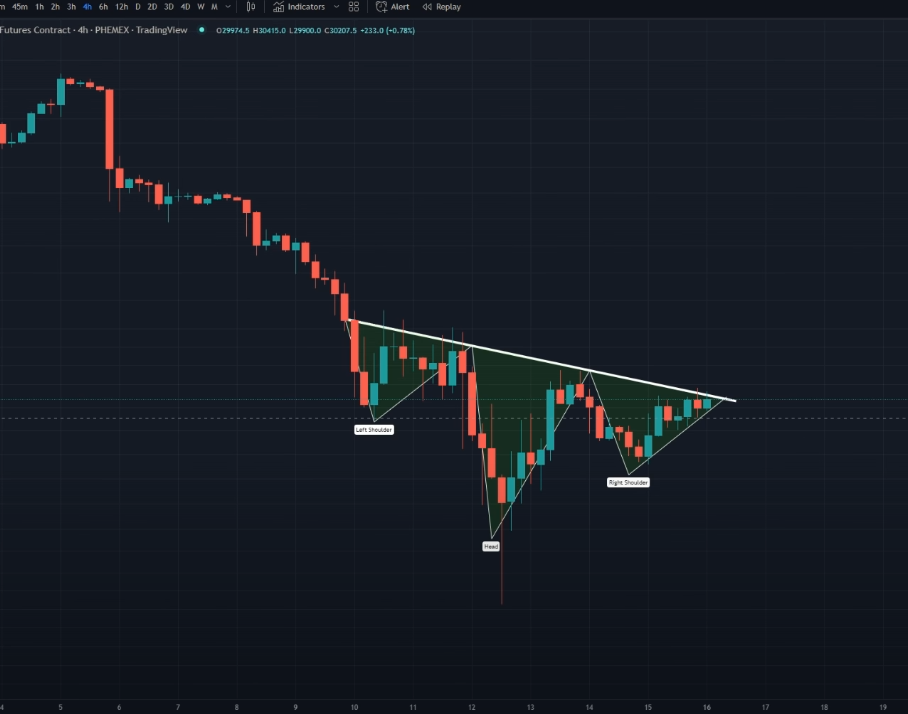
Additionally, while looking at the 4-Hour chart for the Bitcoin, it is noticeable that an inverse head and shoulders pattern is finalizing its formation. To complete this pattern, BTC needs to break above USD 30,500. Closing above that price on the 4-Hour chart will give us a technical breakout price target of USD 34,500.
These short-term divergences are not looking too bad. But, the futures are trending red as China reported retail sales to be significantly lower than expected (-11.1% vs. -3.5%). This indicates that Covid-19 associated lockdowns are hitting harder than expected and are causing demand destruction - more supply chain catastrophes.
What this means is that cryptocurrencies are time and time again holding up with the help of technical price oscillators, but negative news keeps dumping on the support zones. Remember to adjust stop losses, and trade with small sums. Keep the ranges narrow, as swings overnight may cause errors.
Additionally, once important metric to always measure is the Fear and Greed Index (FGI) which tracks multifactorial market sentiment:
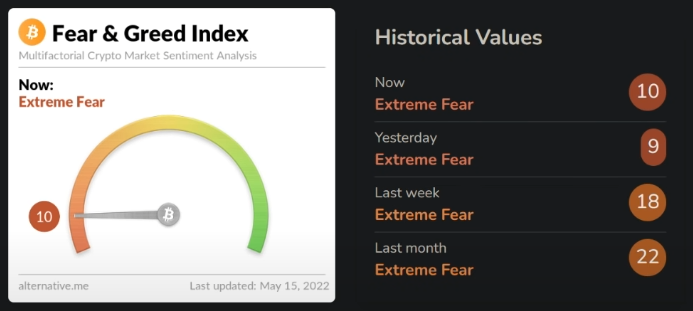
This index derives from volatility, market volume, social media sentiment, survey results, dominance, and trends. Whenever these data sources flip negative, the index goes down. Extreme fear typically is a sign for the investors that it could be a good buying opportunity, while greed sectors show that the market is due for a correction. Daily, we would say this is an excellent buying opportunity. However, Bitcoin is entering its 8th declining week, which has not been seen for years.
To sum up, the current flow shows oversold levels. However, seeing the recent rejection at the USD 31,000 line and failure to close above it on the 4-Hour charts show we are due to see a decline towards that USD 28,000-29,000 support levels.
Historical buying opportunities whisper the bottom
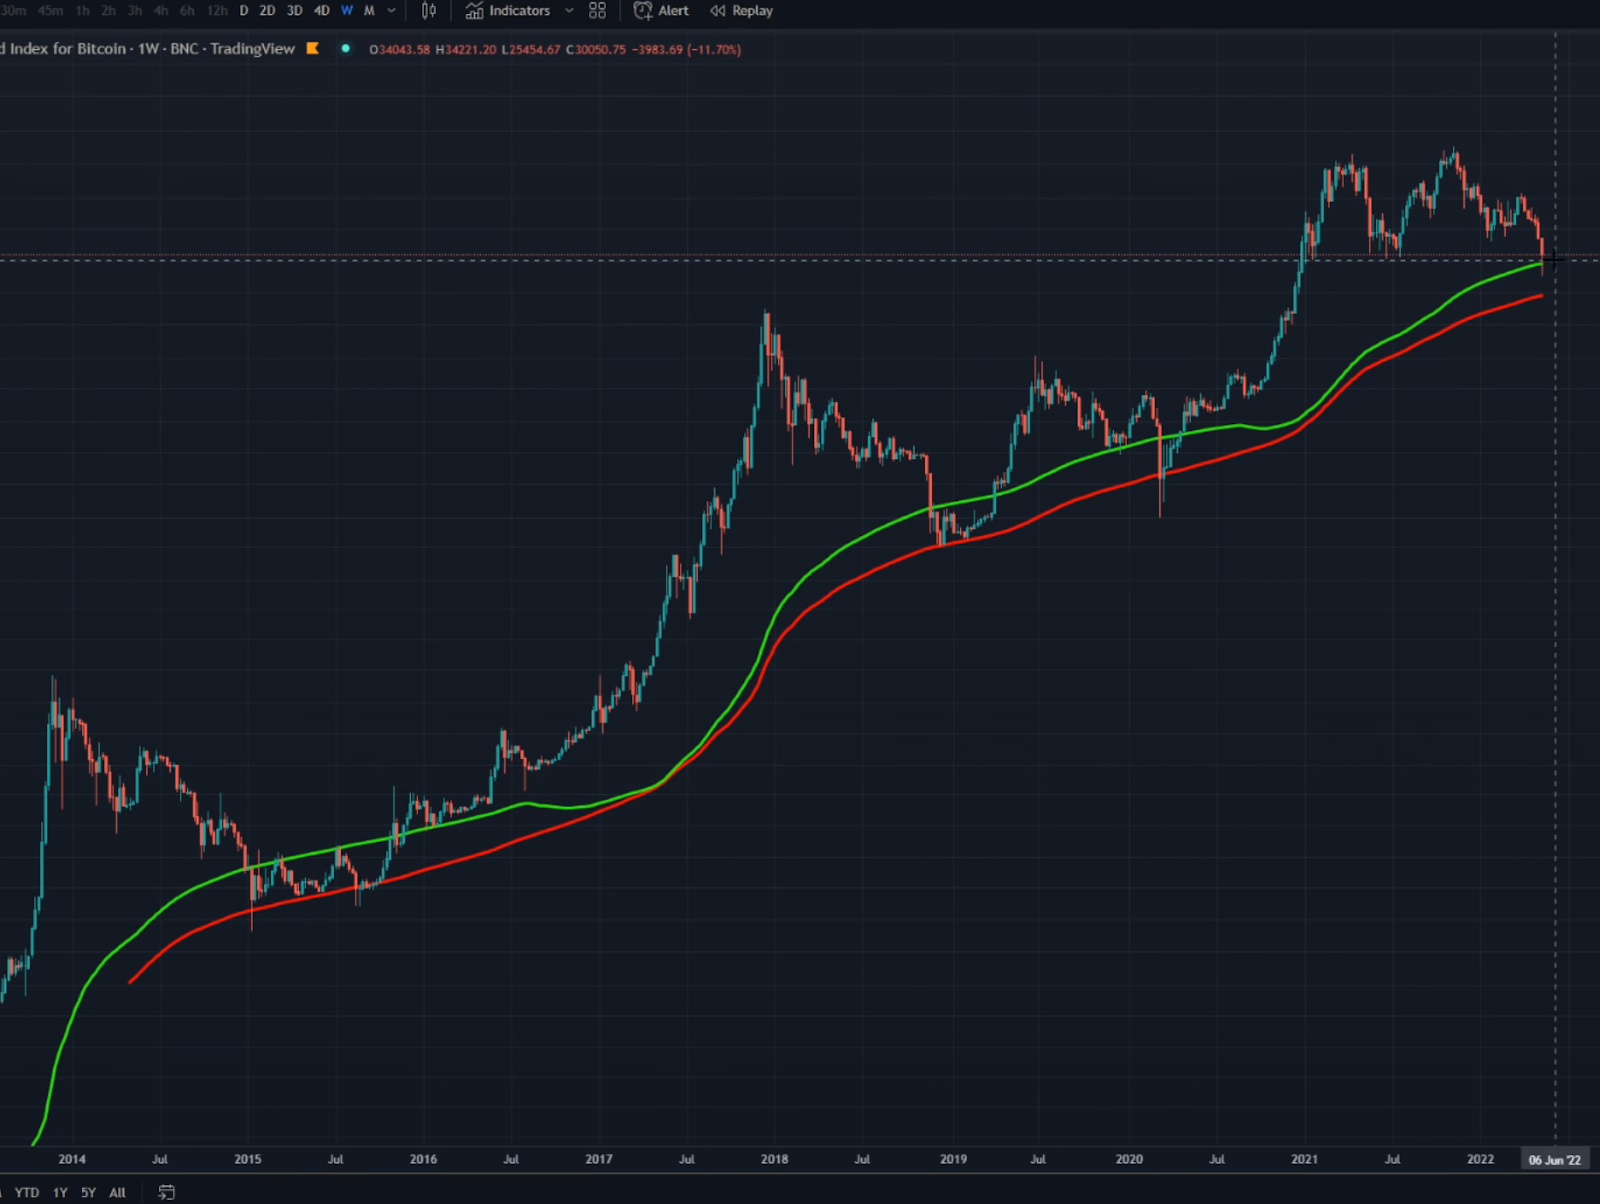
Take a look at the weekly charts with the 1000-day moving average (green line) and 200-week moving average (red line). Currently, these trend lines correlate between USD 28,000 and USD 22,000 ranges. From a technical point of view, we could see wicks below, meaning additional USD 1,000-3,000 drop downs, but they should only last hours, if not minutes. Historically speaking, this gives a legendary buying opportunity, and every single time Bitcoin enters the range in between, it ends up being the best accumulation period.
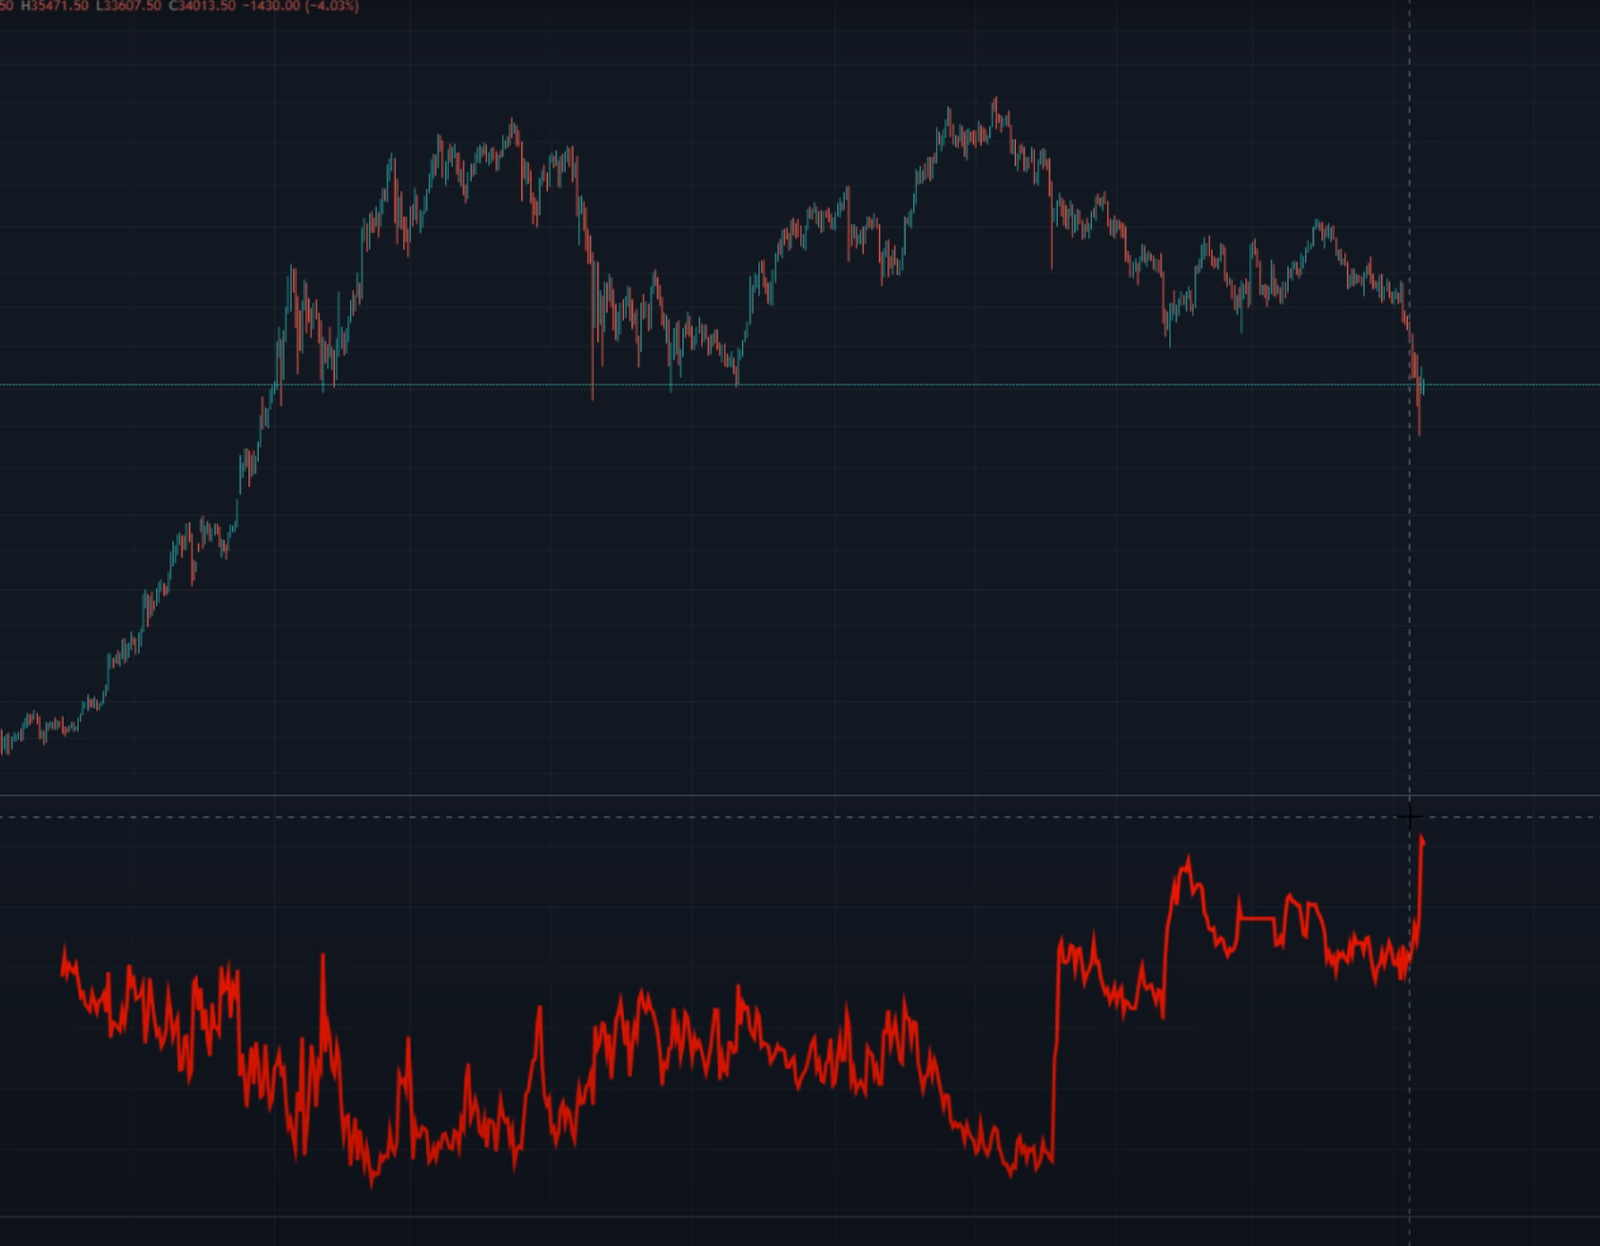
Additionally, we are seeing record high short-positions being opened on multiple exchanges as of this moment. This red line indicates that more traders currently support the negative sentiment, and it usually shows excellent buying opportunities. Once the price spirals to the upside, Bitcoin shorts will have to pay heftier fees or close their positions, putting immediate pressure on the price to go up.
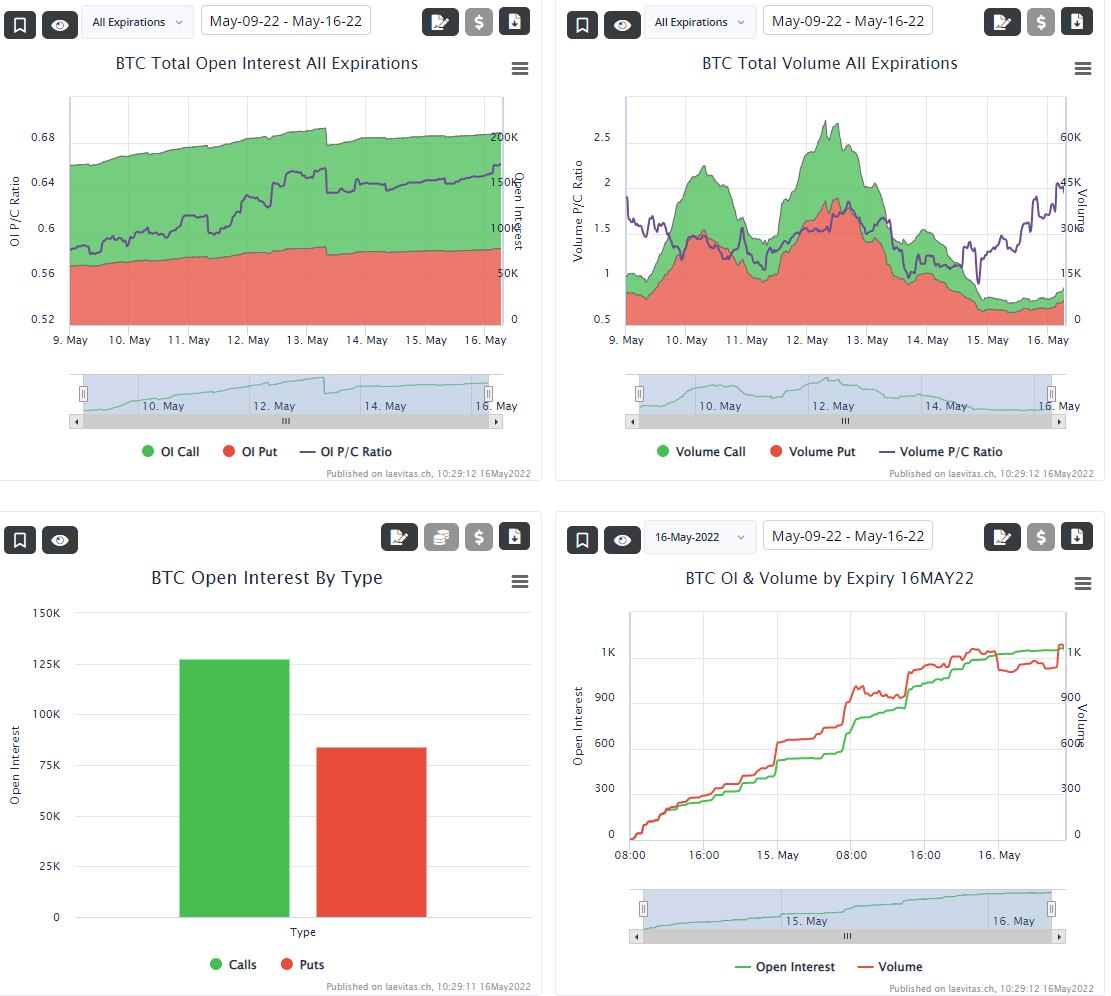
Option action is currently 0.71 favoring puts. Max-pain is at USD 36,000, and the current price is at USD 29,000 levels. This shows that big bets are presently losing a ton of money and are highly interested in bringing the price up to at least break-even levels in the immediate short term. The market often tells us that once the puts dominate heavily (preferably <0.5 to calls), it should be considered to enter a long position.
Can Ethereum recover without the 2.0 upgrade?
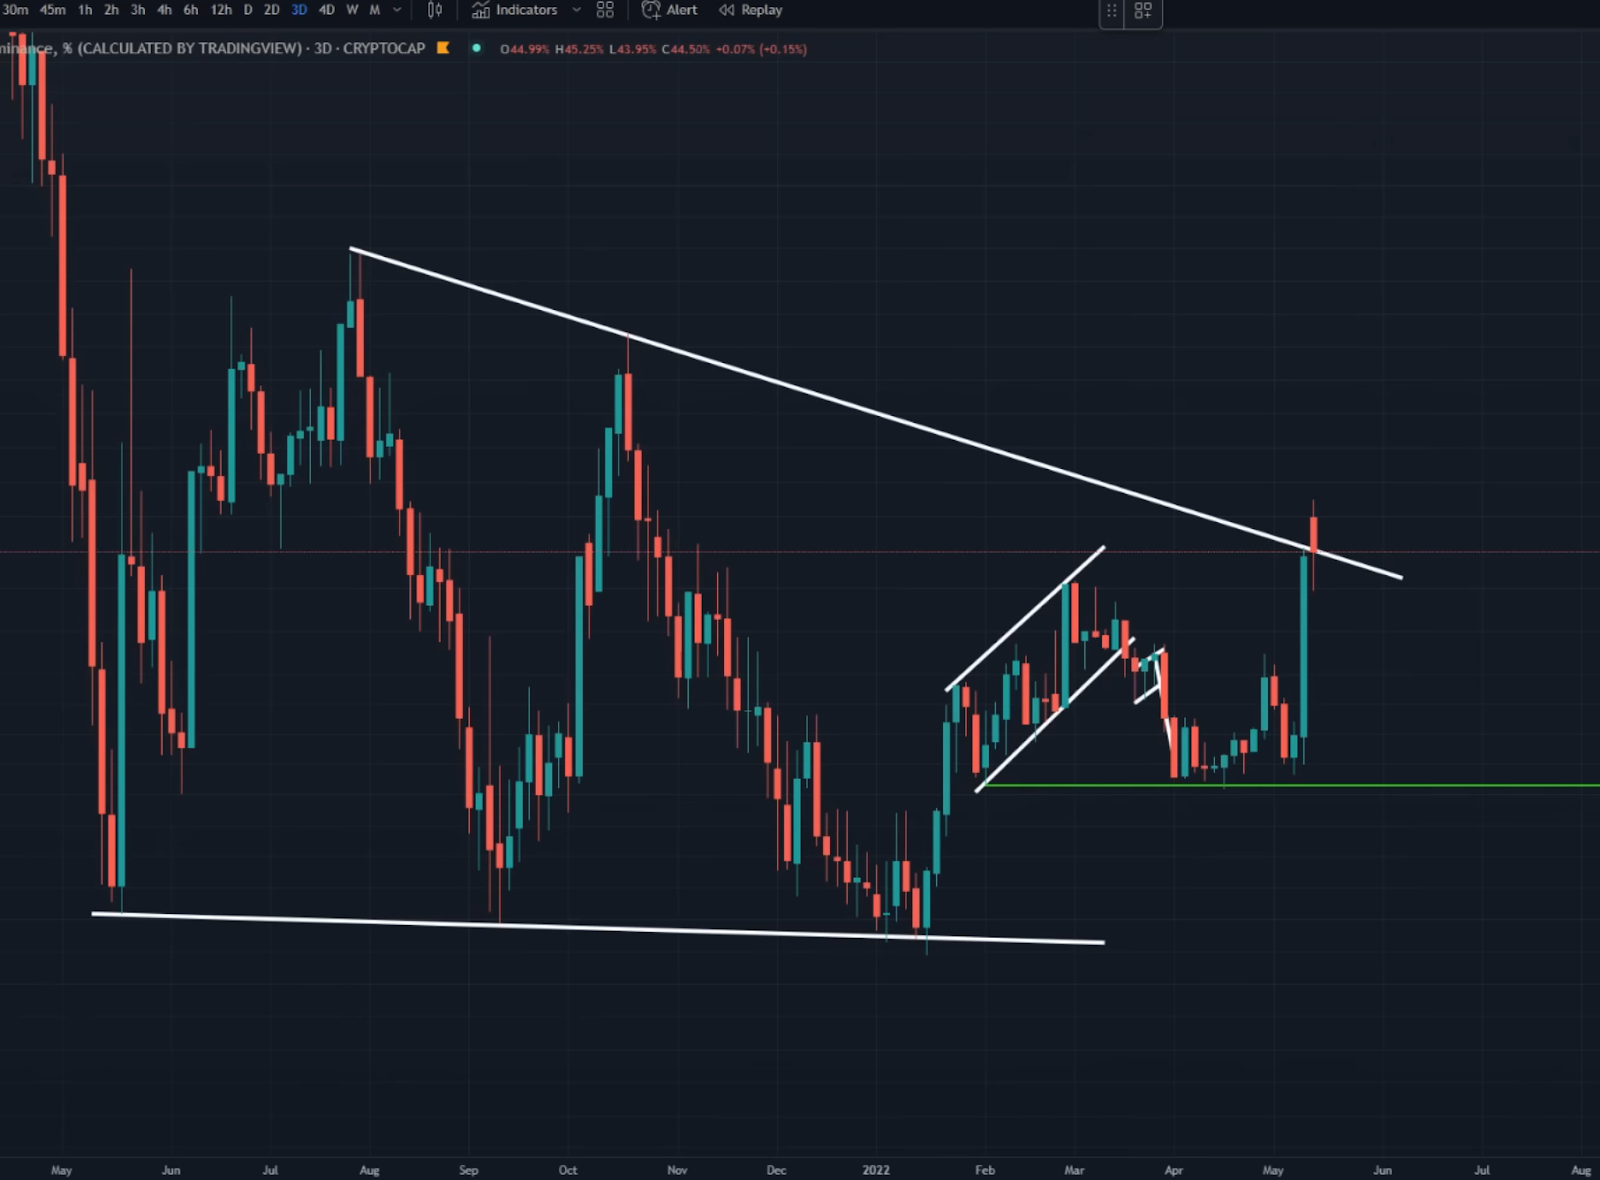
Bitcoin dominance on the 3-Day time frame is still trading above the resistance line at 44.5%. We still have not seen a closure above that level, meaning a bearish movement in the alternative coin sector is not yet confirmed. A successful rejection on that line would signal that alternative coins have not maximized their recent loss recovery. But this was due to the collapse of Luna, hence why we see the vast green candle up, meaning it is only artificial.
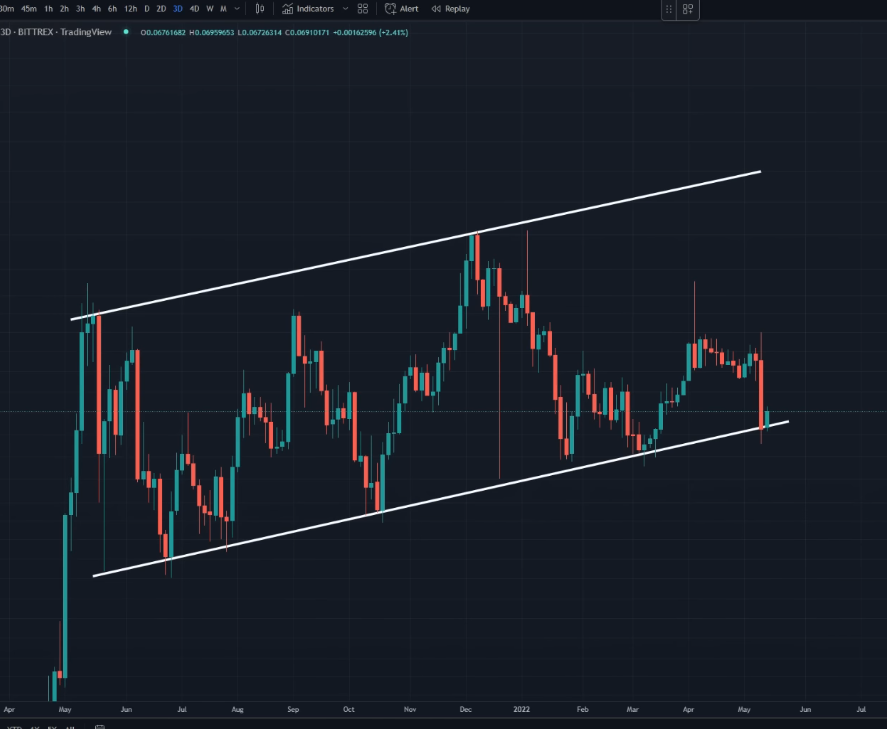
3-Day time frame is still holding that 0.0677 range, but it is highly correlated with the Bitcoin dominance range. Keeping a firm eye on 2160 will be necessary as a make-or-break on a closing basis. To have any expectation of a meaningful rally starting to take hold, ETH requires a move back over 2800 on a close, which seems premature given its poor technical structure and no evidence of downside capitulation. Ranges anywhere between USD 1,700 are outstanding buying opportunities. Still, in the case of cryptocurrency collapse and Bitcoin dominance levels, I would instead accumulate BTC or swap some ETH for BTC.
What to expect from the markets?
We are very close to the realized price levels, and the market price to realized price ratio is very close to the bottom. Dormancy flow has been in the buy zone for the last few months, and, just like the 200-week moving average, it has been a generational buying opportunity. Additionally, reserve risk heading to lower bounds is relatively low. Based on these metrics and price aggregation, the market recently saw a temporary low, but the low is likely near the USD 20,000-25,000 levels.
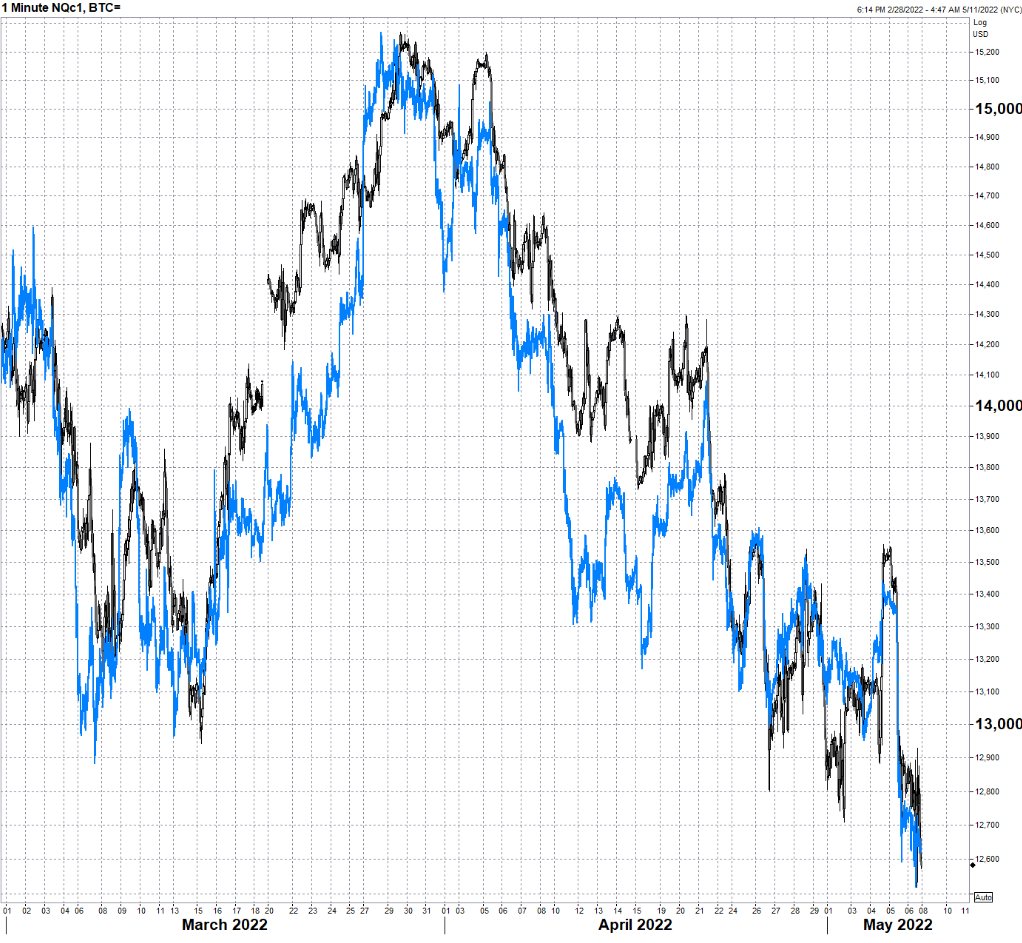
This Nasdaq/Bitcoin chart (Black/Blue) shows that Bitcoin is still a high-beta risk asset and that FED Liquidity Extraction QT will result in Higher Real Yields and end up being a kryptonite for the High PE, NDX, and GOLD/BTC. It is happening fast, and QT likely drives it further until the market screams for relief and FED has to reverse.
Additionally, as the Bitcoin price correlates to the price tag of Nasdaq, Nasdaq correlates to the price tag of SPY.
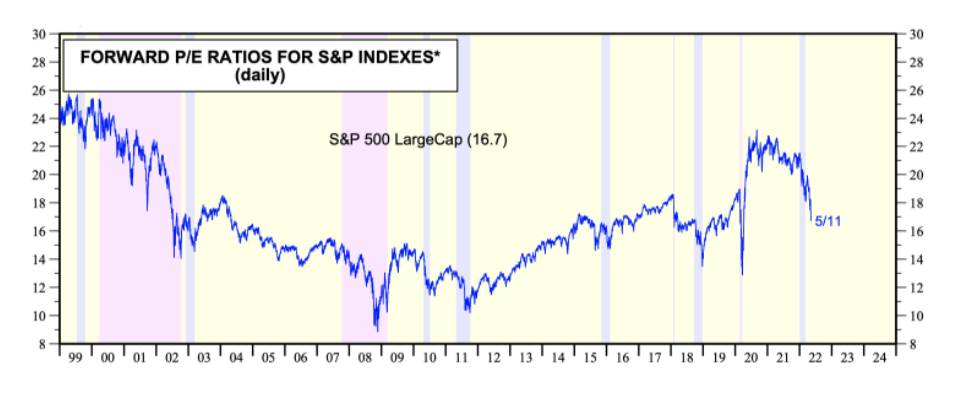
Prior bear markets have ended with the SPY forward multiples of PE being compressed to 14-15. These multiples would take us as low as 3300-3500 range, but 3700 would act as major support.
Conclusion
Keep an eye on the NDX and SPX flow. We believe it bottomed in the short term, but it was not the bottom yet, as not all sectors have been cleared of the overvaluations.
We expect indexes and cryptocurrencies to find a slight relief before all the price oscillators balance out and sell off further in the immediate short term. We target NDX 13000 and BTC 34000-35000 ranges to short/exit.
Historical cycles show that BTC will likely bottom out around the USD 20,000 line to USD 25,000. Be sure to accumulate your most prominent positions in these gaps, and do not be discouraged to see wicks to the downside - in the long run, you will be thankful for these entries.
Avoid limited diversification not to get destroyed by what happened to Luna. Ensure your highest positions are in BTC and ETH, with alternative coins only being supplementary to your portfolio.
We are still in an overall downturn trajectory, and the market has proven time after time that this is not a longing market but rather a swing trade. If you find a 25-40% gain in the immediate short term, maximize profits.
Lastly, inflation growth has been slowing down and we likely saw the highest levels of it up-to-date. While not all sectors have started cooling off, this is somewhat of a possible indicator we are near bottom levels of index prices and a turnaround soon (6-24 month time frame).