What is up, lads! March has been a stormy month, and we finally broke out - let us review what is yet to come and how April should play out:
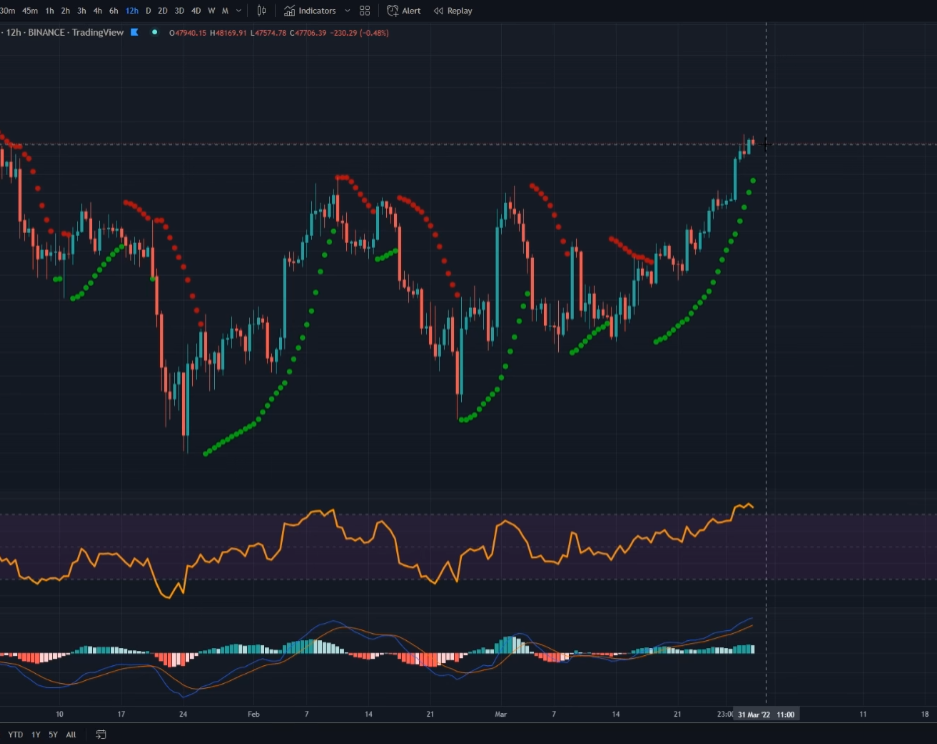
On the 12-hour chart we can see a continuation of the uptrend - Bitcoin is steadily rising to the upside. We are entering a slight cool-off phase - do not be discouraged to see slower momentum and a slight re-test of USD 44 000 & USD 45 000 levels. RSI is currently overbought as the RSI is touching 80 pts levels. Back in December and January lows the markets have signaled various bottom signals. It was a surprise to see BTC go as low as USD 33 000 - because of this, a lot of positive momentum has been squeezed, and cryptocurrencies even fell more behind compared to stock market movement. For example, SPY is only 4% away from reaching its ATH, while BTC has a more significant gap until its former ATH - USD 69 000. Consequently, this is also an indicator showing cryptocurrencies have more upside. But as the volume is dwindling and the stock market sees more appreciation - tread carefully.
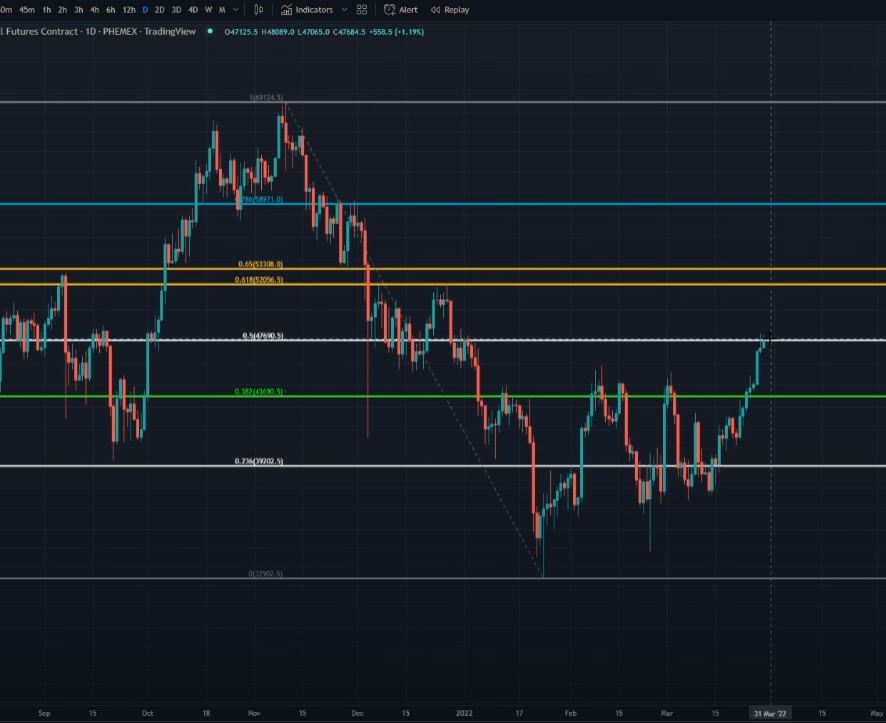
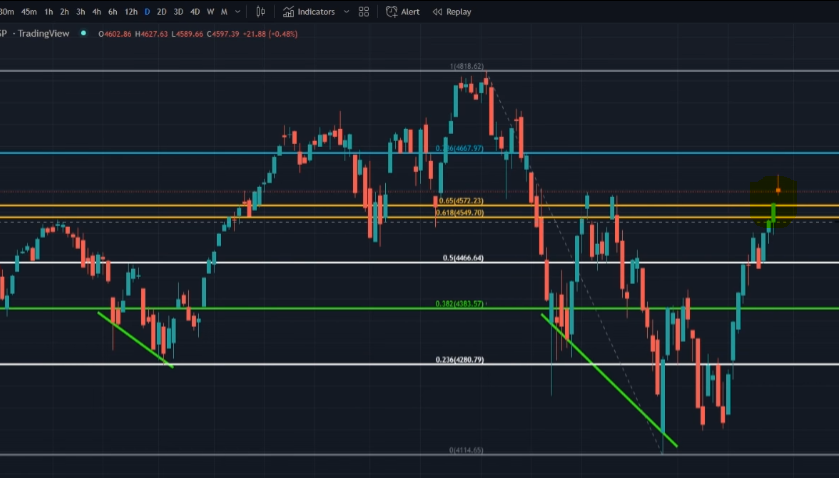
Let us also look at the Fibonacci level indicators - we are now running into an essential line of resistance at USD 48 000. The most critical golden line is at around USD 52 000 and USD 53 000 - breaking this and forming it as support would confirm the final breakout as we would be headed for ATH. Currently, we are failing to break or even touch it, but do remember we are facing a slight cool-off period. After RSI seems lower, it can try to bounce to USD 48 000 levels again.
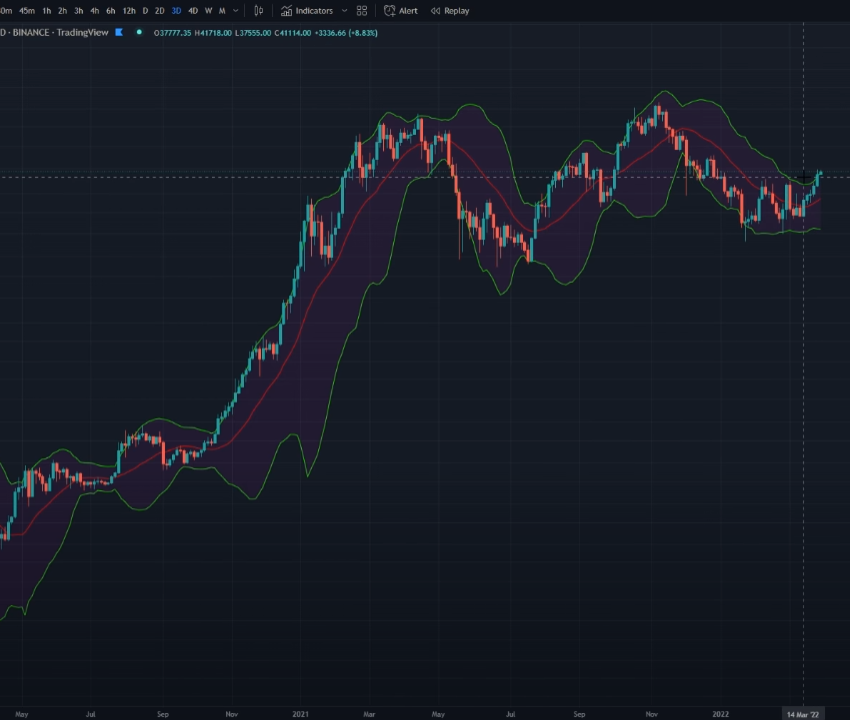
Take a look at the 3-day chart of the Bollinger bands, which is expanding - massive moves on the market are looking bullish as we are breaking out of the channel - 3-day MACD and RSI seem to be bullish and not on the verge of stopping soon just yet.
Additionally, it is essential to note that cryptocurrencies often follow the stock market, so SPY needs to close and mark to support the following lines: 455-460.
These are the current golden pocket levels of resistance that need to be turned into support, preferably on the daily or weekly time frame. This confirms that the stock market is set to see 470 levels again - but do not be tricked, as ATH of 480 is a bit too difficult to reach with current market tendencies.
Now - Ethereum situation:
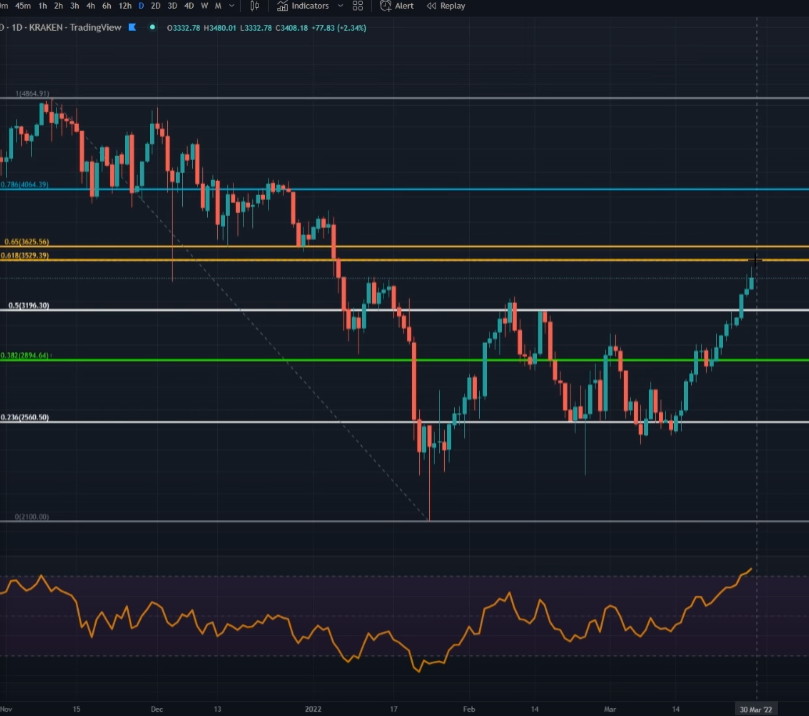
The 12-hour RSI is also overbought as the channels and charts look identical to BTC. USD 3200-3300 should act as the new support, and flipping them into resistance again would not be good.
As we can see from the picture below, golden pocket levels are at USD 3500-3600. Flipping those into support would be incredibly bullish, and ETH looks to be on the verge of success on the daily time frames. Keep in mind that large time frames are more bearish for Ethereum.
The world is also talking about the upcoming merge in summer, and whales have been accumulating ETH more than ever. Our technical consensus remains that ETH's fair value is around USD 5000. Therefore, every lower price is currently seen as a significant discount - plan accordingly.
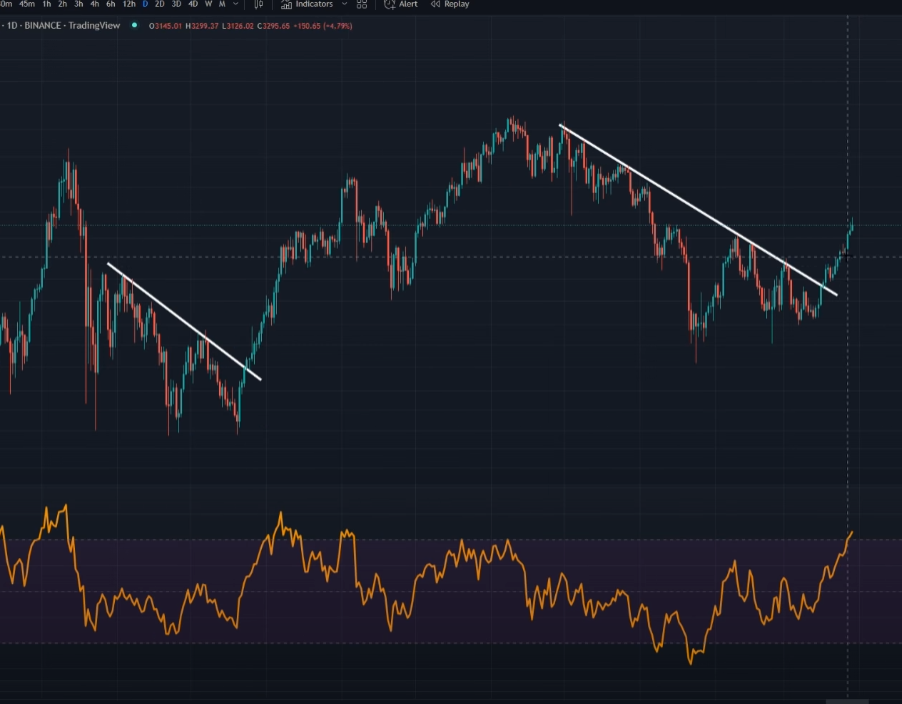
One key thing to note here is that current price actions represent similar movements to 2021 July-September levels. Two months were in a bearish trend - the next two flipped and pushed to all-time highs. Using these time frames is not recommendable, but this could indicate yet another rally lasting for a month or two - similarly to what market makers expect the stock market to do.
Take a look at the picture below to understand what I mean:
Bitcoin dominance is slightly breaking down to the lows, but currently finding support formations. Definitely, not a confirmed alternative coin season yet, but keep an eye on that right side angle to start breaking down below and the USDT dominance chart to go lower than 3.86 levels.
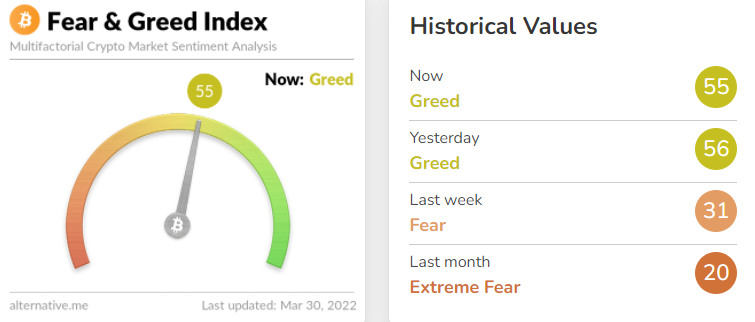
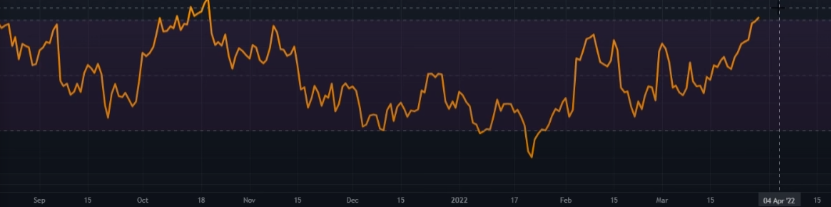
Fear and greed levels jumped from extreme fear just last month into a greed.
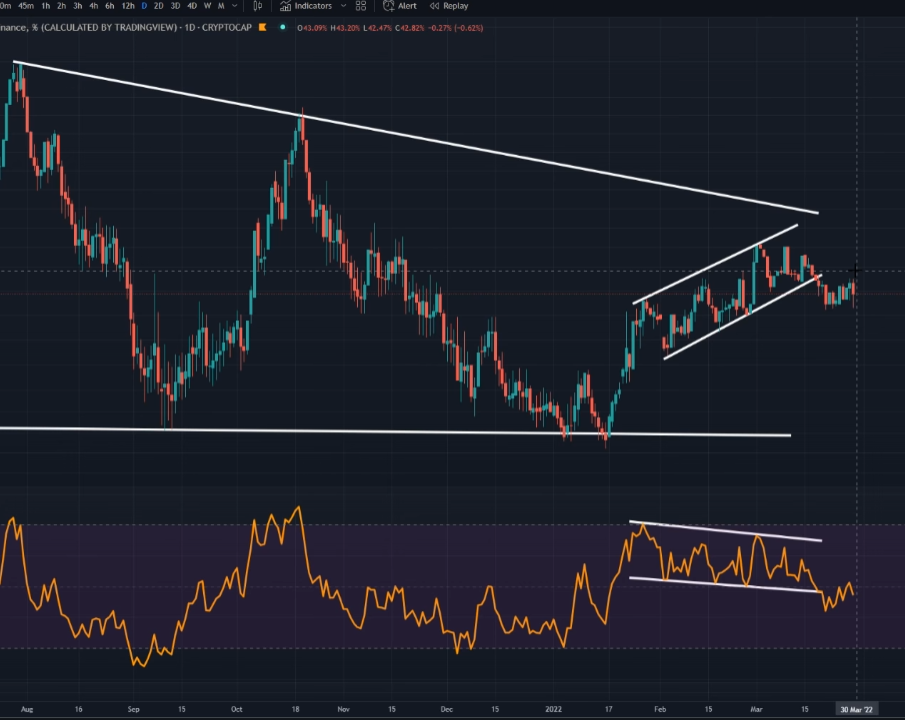
Above is the BTC dominance chart for reference.
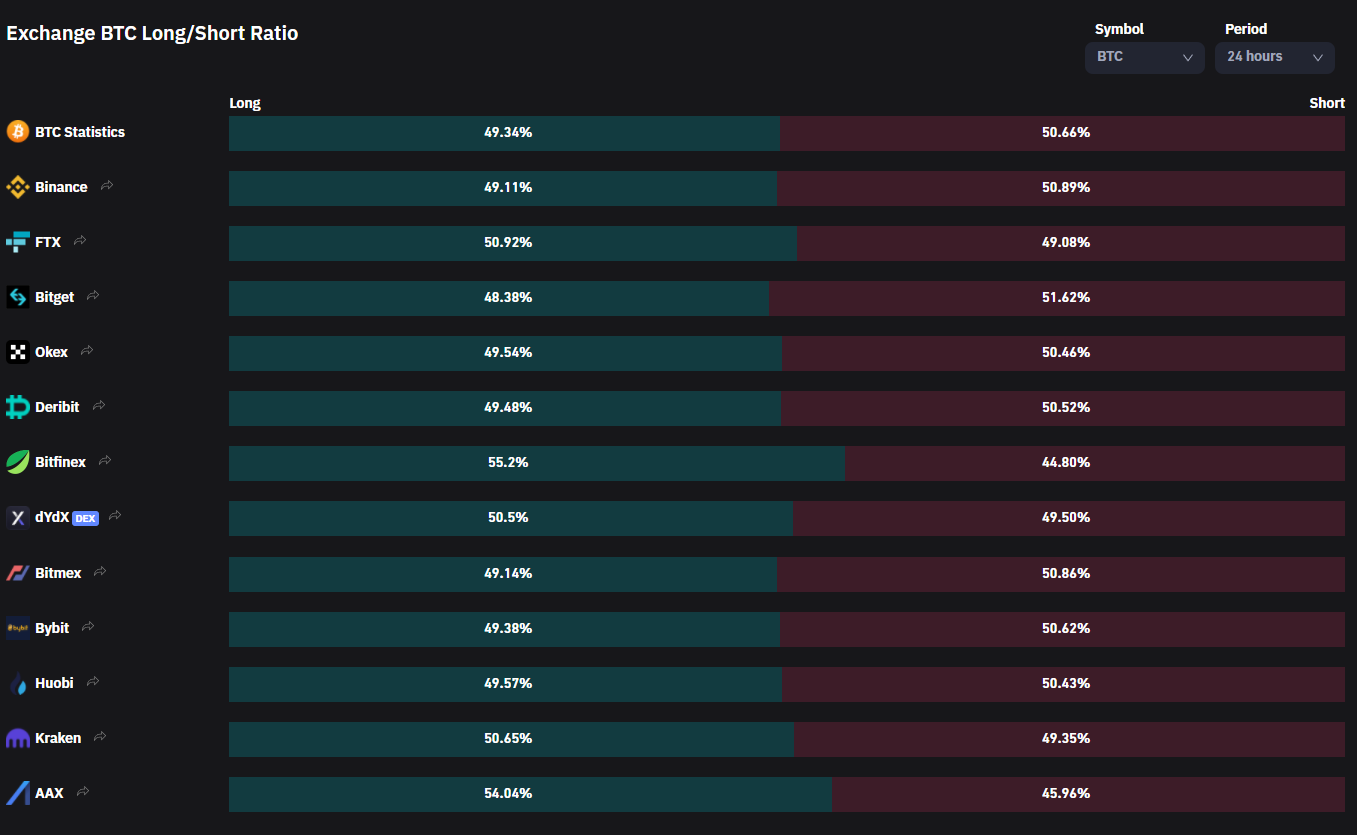
Above is the estimated long/short ratio on the 24-hour horizon - as expected, short term cool off.
Conclusion:
- Cryptocurrencies have more room for upside compared to the stock market.
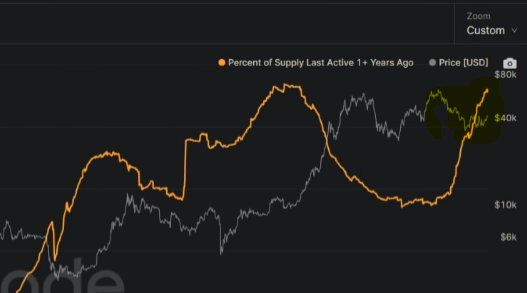
- Active supply is trending upwards, signaling bullish momentum.
- BTC/ETH cools off in the short term but still looks strong for the longer horizon, especially if USD 48 000 and USD 3 500 flip into support levels.
- Whales are accumulating and buying currently.
- Alternative coin season is not yet confirmed. BTC dominance is holding steadily.
- Watch the USDT dominance chart to break below 3.86 levels for confirmation.
- Do not be discouraged by possible drops to USD 44 000 - USD 45 000 as they should be tested as new supports.
- I am currently encouraged to accumulate more Ethereum than Bitcoin.